Multiple axes are commonly used when you have the following:
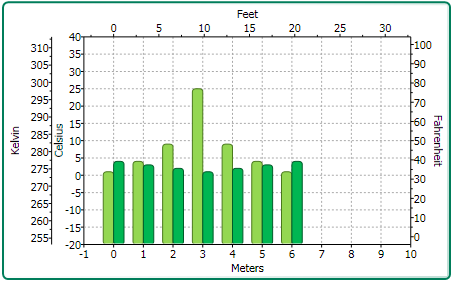
The following chart uses five axes to effectively display the length and temperature in both metric and non-metric measurements:
You can add multiple axes to the chart by adding a new Axis object and then specifying its type (X, Y, or Z) for the AxisType property.
The following XAML markup shows how to add multiple Y-axes to the chart:
| XAML |
Copy Code
|
|---|---|
<c1chart:C1Chart Margin="0" Name="c1Chart1"> <c1chart:C1Chart.View> <c1chart:ChartView> <!-- Auxiliary y-axes --> <c1chart:Axis Name="ay2" AxisType="Y" Position="Far" Min="0" Max="10" /> <c1chart:Axis Name="ay3" AxisType="Y" Position="Far" Min="0" Max="20" /> <c1chart:Axis Name="ay4" AxisType="Y" Position="Far" Min="0" Max="50" /> </c1chart:ChartView> </c1chart:C1Chart.View> <c1chart:C1Chart.Data> <c1chart:ChartData> <c1chart:DataSeries Values="1 2 3 4 5" /> <c1chart:DataSeries AxisY="ay2" Values="1 2 3 4 5" /> <c1chart:DataSeries AxisY="ay3" Values="1 2 3 4 5" /> <c1chart:DataSeries AxisY="ay4" Values="1 2 3 4 5" /> </c1chart:ChartData> </c1chart:C1Chart.Data> </c1chart:C1Chart> |
|