Pie charts are commonly used to display simple values. They are visually appealing and often displayed with 3D effects such as shading and rotation.
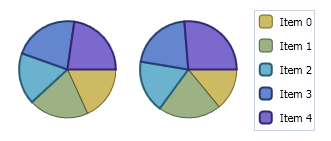
Pie charts have one significant difference when compared to other C1Chart chart types in Pie charts; each series represents one slice of the pie. Therefore, you will never have Pie charts with a single series (they would be just circles). In most cases, Pie charts have multiple series (one per slice) with a single data point in each series. C1Chart represents series with multiple data points as multiple pies within the chart.
If you wanted to create a Pie chart using XAML markup, the markup should resemble the following:
| XAML |
Copy Code
|
|---|---|
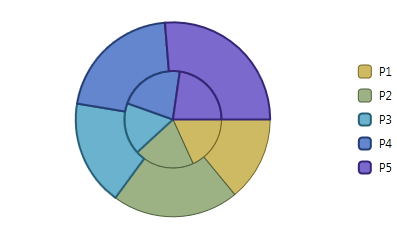
<c1chart:C1Chart Name="c1Chart1" ChartType="Pie"> <c1chart:C1Chart.Data> <c1chart:ChartData> <c1chart:ChartData.ItemNames>P1 P2 P3 P4 P5</c1chart:ChartData.ItemNames> <c1chart:DataSeries Values="20 22 19 24 25" /> </c1chart:ChartData> </c1chart:C1Chart.Data> <c1chart:C1ChartLegend DockPanel.Dock="Right" /> </c1chart:C1Chart> |
|
There are a few special properties that can help you customize your Pie Chart control. Using the SetStartingAngle or Direction properties allows you to change the initial starting angle of your Pie Chart or change the direction of the slices. You can also explode a pie slice out from the main chart to highlight it using the BasePieRenderer property.
Starting Angle
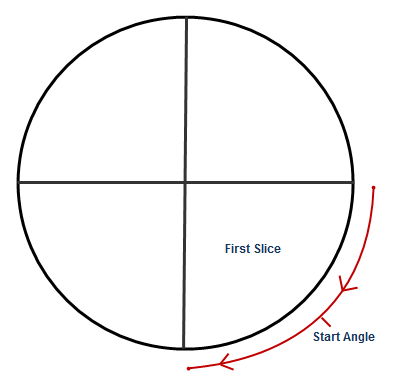
The PieOptions.SetStartingAngle property defines the position of the first slice within the Pie Chart. The first slice always begins at 90 degrees. The Start Angle runs clockwise from the 90 degree angle.
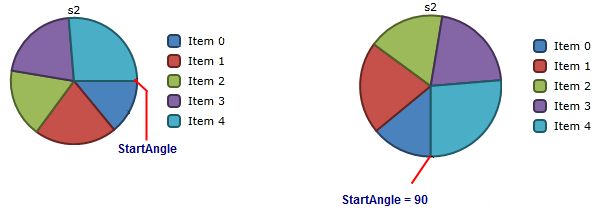
Use the PieOptions.SetStartingAngle property to specify the angle at which the slices for the first series start. You can see what happens when you set the Start Angle to 90 in the image below:
Direction
Use the PieOptions.Direction attached property to specify the direction the chart is drawn as an elliptical arc. Options include:
SeriesLabelTemplate
Use the PieOptions.SeriesLabelTemplate property to specify the template for the series label of a pie chart. Create a DataTemplate to set the content of the series label.
Exploding Pies
A slice of a Pie chart can be emphasized by exploding it, which extrudes the slice from the rest of the pie. Use the Offset property of the series to set the exploded slice's offset from the center of the pie. The offset is measured as a percentage of the radius of the pie.
Chart for WPF and Silverlight supports the following types of Pie charts:
Regular Pie Charts (WPF and Silverlight)
| Pie | PieStacked |
 |
 |
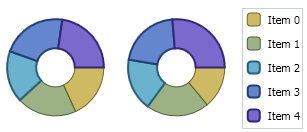
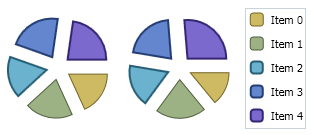
| DoughnutPie | ExplodedPie |
 |
 |
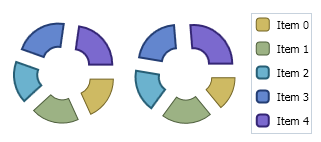
| ExplodedDoughnutPie | |
 |
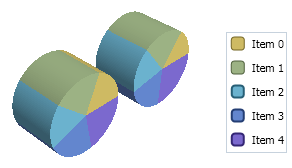
3D Pie Charts (WPF ONLY)
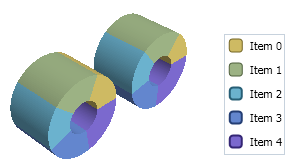
| 3DPie | 3DDoughnutPie |
 |
 |
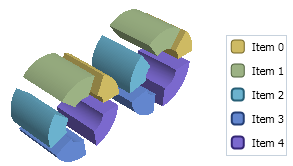
| 3DExplodedPie | 3DExplodedDoughnutPie |
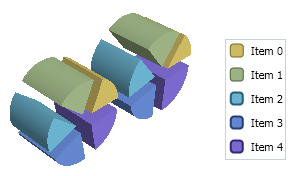 |
 |