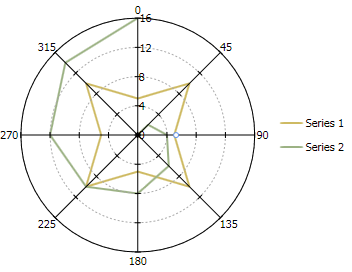
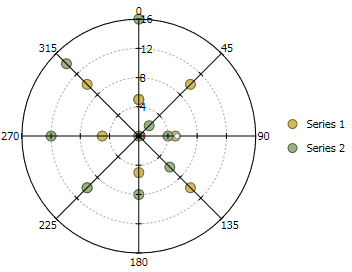
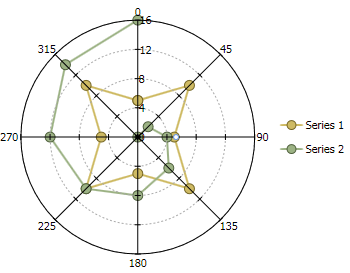
A Polar chart draws the x and y coordinates in each series as (theta,r).
Since the X-axis is a circle, the X-axis maximum and minimum values are fixed.
Polar charts cannot be combined with any other chart type in the same chart area.
The XAML markup below specifies the data values for the XYDataSeries and is used to create the images that follow the markup:
| XAML |
Copy Code
|
|---|---|
<c1chart:C1Chart Name="c1Chart1" ChartType="PolarLinesSymbols"> <c1chart:C1Chart.Data> <c1chart:ChartData> <c1chart:XYDataSeries Label="Series 1" Values="5 10 5 10 5 10 5 10 5" XValues="0 45 90 135 180 225 270 315 0"/> <c1chart:XYDataSeries Label="Series 2" Values="0 2 4 6 8 10 12 14 16" XValues="0 45 90 135 180 225 270 315 0"/> </c1chart:ChartData> </c1chart:C1Chart.Data> <c1chart:C1ChartLegend DockPanel.Dock="Right" /> </c1chart:C1Chart> |
|
| PolarLines | PolarSymbols |
 |
 |
| PolarLinesSymbols | |
 |