A Radar chart is a variation of a Polar chart. A Radar chart draws the y value in each data set along a radar line. If the data has n unique points, then the chart plane is divided into n equal angle segments, and a radar line is drawn (representing each point) at 360/n degree increments. By default, the radar line representing the first point is drawn vertically (at 90 degrees).
The labels for radar chart can be set using ChartData.ItemNames property. These labels are located at end of each radial line.
Setting the Starting Angle
The PolarRadarOptions.SetStartingAngle attached property of the PolarRadarOptions class sets the starting angle for Radar charts. The Start Angle allows you to rotate the chart clockwise. For example, if you set the SetStartingAngle property to 90, then the chart will rotate clockwise by 90 degrees.
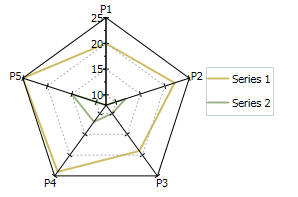
The following image represents the Radar chart when you set ChartType property to Radar.
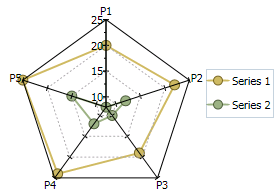
The following image represents the Radar chart with symbols when you set the ChartType property to RadarSymbols.
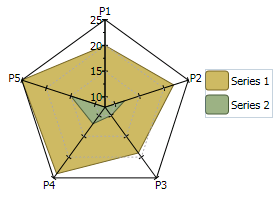
The following image represents the filled Radar chart when you set the ChartType property to RadarFilled.