For developers using MVVM, the number of series can be completely generated in the View Model using two ChartData object properties: SeriesItemSource and SeriesItemTemplate.
In a scenario where you'd like to plot a different data series for each year and the number of years is unknown at design-time, you can determine the number of years in the View Model.
First we'll highlight some of the elements in binding the properties to the ViewModel. Following the highlighted XAML markup and code, the Automatic Series Generation with MVVM topic contains all the necessary markup and code.
You can see the teo properties in the following XAML markup:
| XAML |
Copy Code
|
|---|---|
<c1:C1Chart Name="c1Chart1"> <c1:C1Chart.Data> <c1:ChartData SeriesItemsSource="{Binding SeriesDataCollection}"> <c1:ChartData.SeriesItemTemplate> <DataTemplate> <c1:DataSeries Label="{Binding Year}" ValuesSource="{Binding Values}" /> </DataTemplate> </c1:ChartData.SeriesItemTemplate> </c1:ChartData> </c1:C1Chart.Data> <c1:C1ChartLegend DockPanel.Dock="Right" /> </c1:C1Chart> |
|
The SeriesItemsSource and SeriesItemTemplate properties are both set on the ChartData object. The SeriesItemsSource is bound to the ViewModel, as are the Label and ValuesSource properties for the SeriesItemTemplate.
Highlighting two sections of the ViewModel, the first creates the ObservableCollection of SeriesData:
| C# |
Copy Code
|
|---|---|
public ObservableCollection<SeriesData> SeriesDataCollection { get { if (_seriesDataCollection == null) { _seriesDataCollection = new ObservableCollection<SeriesData>(); for (int i = 0; i < ViewModelData.NUM_SERIES; i++) _seriesDataCollection.Add(new SeriesData(2010 + i)); } return _seriesDataCollection; } } |
|
The second section of code is our custom business object. It contains the year and data value:
| C# |
Copy Code
|
|---|---|
public class SeriesData : INotifyPropertyChanged { int _year; double[] _values; public SeriesData(int year) { _year = year; _values = new double[ViewModelData.NUM_POINTS]; for (int i = 0; i < ViewModelData.NUM_POINTS; i++) _values[i] = ViewModelData.Rnd.Next(0, 100); } public int Year { get { return _year; } set { if (_year != value) { _year = value; OnPropertyChanged("Year"); } } } public double[] Values { get { return _values; } set { if (_values != value) { _values = value; OnPropertyChanged("Values"); } } } |
|
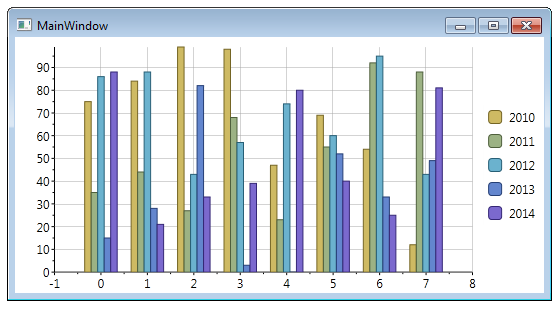
When you run your program, or run the sample, it should resemble the following image: