Chart3D for WPF and Silverlight allows you to show a legend for contour or zone charts.The legend element displays information about each data series of the chart. The chart legend displays the mapping between the physical colors and the data series. It is controlled by the Legend property of C1Chart3D.
To add a legend for the chart, follow these steps:
XAML
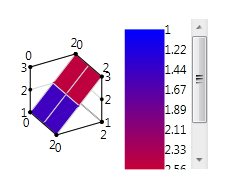
XAML Your chart will look similar to the following:
Note that a legend is visible for contour or zone charts only.