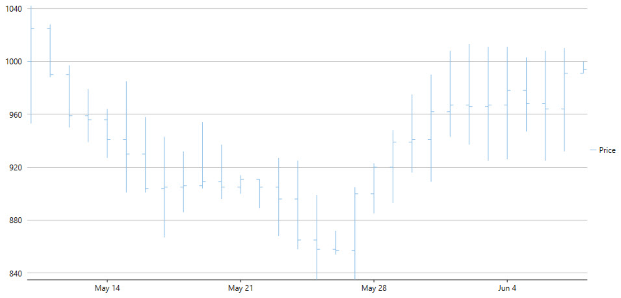
The HighLowOpenClose Chart is generally used in stock analysis. The chart combines four independent values to supply high, low, open, and close data values for each data point in a series.
WPF HighLowOpenClose Chart
See the following code for implementing the scenario: