FlexChart | ComponentOne
FlexChart / Understanding FlexChart / FlexChart Types / WPF Mixed Charts
In This Topic
    WPF Mixed Charts
    In This Topic

    FlexChart allows you to create mixed charts that offer two key advantages, as follows:

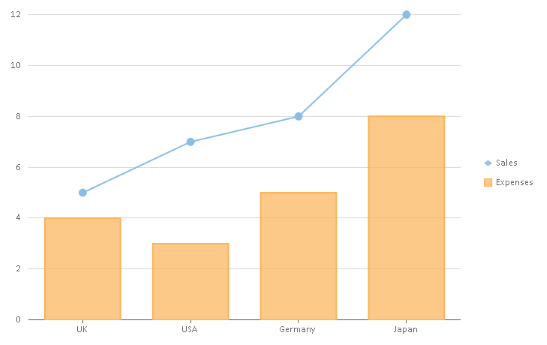
    The following image displays a mixed chart that combines column and line symbols chart types. The chart plots and compares sales and expenses data of four countries.

    The following code sets the Column chart type for FlexChart and overrides it by setting the LineSymbols chart type for the Sales series, thereby implementing WPF mixed charts.

    <c1:C1FlexChart x:Name="flexChart" 
                    BindingX="Country" 
                    ChartType="Column" 
                    ItemsSource="{Binding DataContext.Data}">
        <c1:Series SeriesName="Sales" 
                   Binding="Sales" 
                   ChartType="LineSymbols"/>
        <c1:Series SeriesName="Expenses" 
                   Binding="Expenses"/>
    </c1:C1FlexChart>
    
    See Also