FlexChart | ComponentOne
FlexChart / Working with FlexChart / Binding
In This Topic
    Binding
    In This Topic

    Binding provides a way to create a link between FlexChart and the application data . FlexChart allows you to bind data coming from databases as well as data stored in other structures, such as arrays and collections. This topic discusses three ways to provide data to a chart.

    Chart Binding

    Chart binding is the simplest form of binding in which you just have to set a data source by setting the ItemsSource property and then map the Binding and BindingX property of FlexChart class to fields that you want to plot on Y-axis and X-axis of the chart respectively.

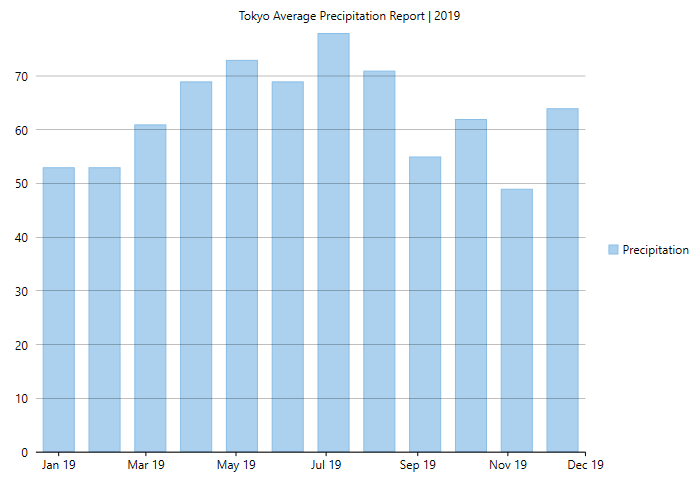
    The below code demonstrates the implementation of chart binding.

    private void Page_Loaded(object sender, RoutedEventArgs e)
    {
       //Clearing default Series present in chart
       flexChart.Series.Clear();
       //Passing data to FlexChart
       flexChart.ItemsSource = GetTemperatureData("Tokyo", 360).Data;
       //Setting FlexChart's Header
       flexChart.Header = "Tokyo Average Precipitation Report | 2019";
       //Binding chart's AxisX to 'Date' 
       flexChart.BindingX = "Date";
       //Adding a Series to chart and binding it's (AxisY) to 'Precipitation' field of Data
       flexChart.Series.Add(new Series
       {
          //SeriesName property specifies the string to be displayed corresponding to this Series in Legend
          SeriesName = "Precipitation",
          Binding = "Precipitation"
       });
    }
    
    static Random rnd = new Random();
    public static CityTemperatureData GetTemperatureData(string city, int count = 360)
    {
          var startDate = new DateTime(2019, 1, 1);
          var dataItem = new CityTemperatureData() { Name = city };
          for (int i = 0; i < count;)
          {
              var temp = new Temperature();
              DateTime date = startDate.AddDays(i);
              temp.Date = date;
              temp.Precipitation = (date.Month > 6 && date.Day < 20) ? rnd.Next(45, 80) : rnd.Next(50, 75);
              dataItem.Data.Add(temp);
              i += 31;
           }
           return dataItem;
    }
    
    <Grid>
            <c1:C1FlexChart x:Name="flexChart" ItemsSource="{Binding DataSource.Data}" 
            Binding="Precipitation" BindingX="Date" Header="Tokyo Average Precipitation Report | 2019">
                    <c1:Series SeriesName="Precipitation"/>
            </c1:C1FlexChart>
    </Grid>
    

    Note that the above sample code uses a custom method named GetTemperatureData to supply data. You can set up the data source as per your requirements.

    Axis Binding

    Axis binding refers to binding an axis with a separate data source to render axis labels different from what gets displayed on binding the chart with the chart data source. For example, we can override the Y-axis labels that are rendered automatically on binding with chart data source to display the precipitation values in mm. FlexChart provides ItemsSource and Binding properties so that you can bind your axes to another data source.

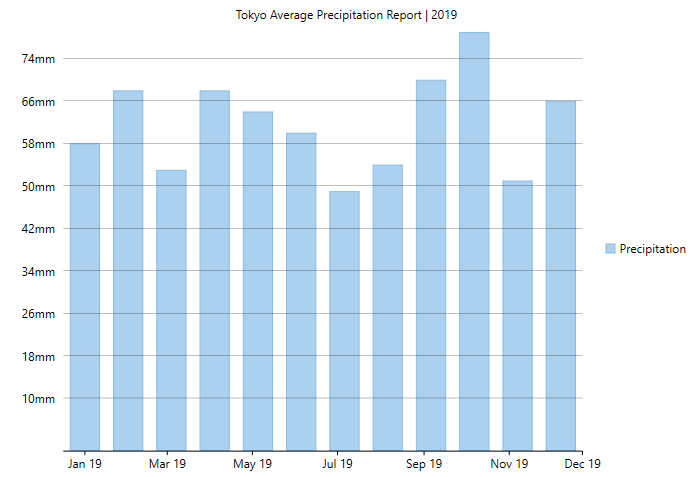
    The below code demonstrates the implementation of axis binding.

    //Passing data to FlexChart's AxisY
    flexChart.AxisY.ItemsSource = GetAxisBindinglabels();
    //Setting which fields to bind to AxisY
    flexChart.AxisY.Binding = "Value,Text";
    
    //Create data for axis binding
    public static List<object> GetAxisBindinglabels()
    {
          var data = new List<object>();
          for (double i = 10; i < 2500; i += 8)
          {
              data.Add(new { Value = i, Text = i / 100 >= 10 ? string.Format("{0} mm", i / 1000) : string.Format("{0}mm", i) });
          }
          return data;
    }
    
    <Grid>
          <c1:C1FlexChart x:Name="flexChart" ItemsSource="{Binding DataSource.Data}"
           BindingX="Date" Header="Tokyo Average Precipitation Report | 2019" >
              <c1:Series SeriesName="Precipitation" Binding="Precipitation"/>
              <c1:C1FlexChart.AxisY>
                  <c1:Axis Title="Precipitation in mm" Binding="Value,Text"/>
              </c1:C1FlexChart.AxisY>
          </c1:C1FlexChart>
     </Grid>
    

    Note that the above sample code uses a custom method named GetAxisBindinglabels to supply data. You can set up the data source as per your requirements.

    Series Binding

    In series binding, you can bind a particular series to a separate data source and display the data which is not there in the original data source. For instance, in the example from above two sections, we can further add another series to show the average monthly precipitation in the same chart from a different data source.

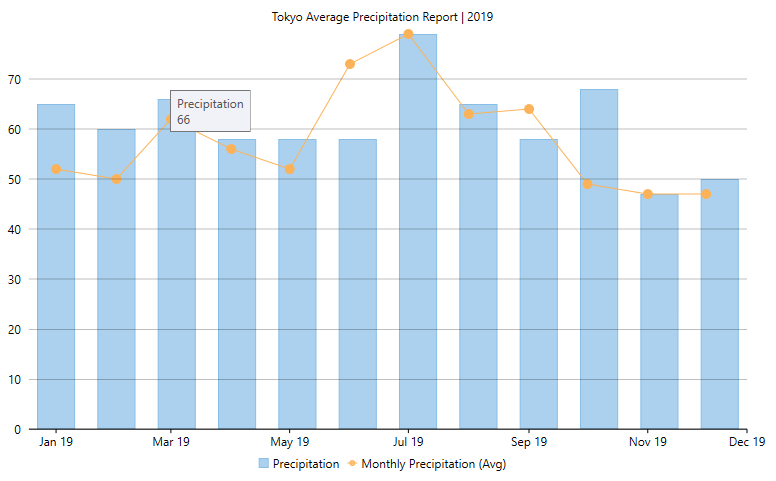
    The below code demonstrates the implementation of series binding.

    //Create data for AxisX
    var monthlyData = GetTemperatureData("Tokyo", 360).Data.GroupBy(x => x.Date.Month).SelectMany(grp => grp.Select(val => new
    {
        Date = new DateTime(val.Date.Year, grp.Key, 15),
        Value = grp.Average(x => x.Precipitation),
    })).Distinct().ToList();
    flexChart.Series.Add(new Series
    {
        SeriesName = "Monthly Precipitation (Avg)",
        Binding = "Value",
        ChartType = ChartType.LineSymbols,
        ItemsSource = monthlyData,
    });
    
    <Grid>
         <c1:C1FlexChart x:Name="flexChart" ItemsSource="{Binding DataSource.Data}"
             BindingX="Date" Header="Tokyo Average Precipitation Report | 2019">
             <c1:Series SeriesName="Precipitation" Binding="Precipitation"/>
             <c1:Series SeriesName="Monthly Precipitation (Avg)" ChartType="LineSymbols" Binding="Value"/>
         </c1:C1FlexChart>
    </Grid>
    

    In XAML, you can use the following code pass data for series binding.

    flexChart.Series[1].ItemsSource = GetSeriesData