FlexPivot lets you easily summarize data in different ways.
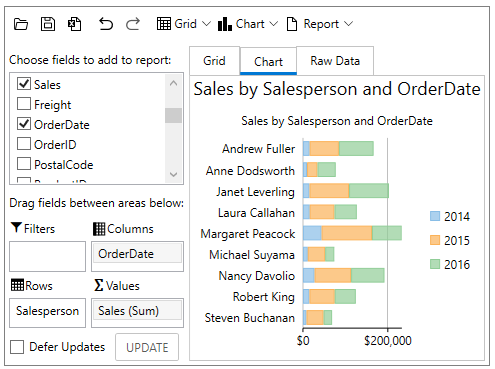
Let us create a new view to illustrate how you can summarize the FlexPivot grid data in different ways. For this, drag the “SalesPerson” field to the “Rows” list and the “OrderDate” field to the “Columns” list. The resulting view contains one column for each day when an order was placed. This is not very useful information, because there are too many columns to show any trends clearly. Therefore, it would be better to summarize the data by month or year instead.
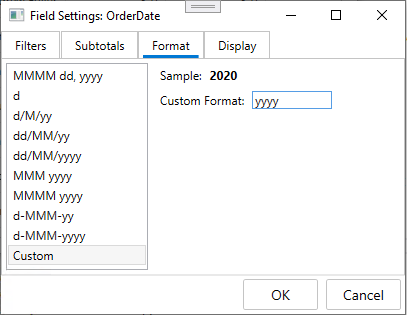
The simplest way to summarize the data by month or year is to simply modify the parameters of the “OrderDate” field. To do this, follow these steps:
Observe that the dates are now formatted and summarized by year, and the FlexPivotChart looks appears as follows:
Alternatively, if you want to check how sales are placed by month or weekday, you can simply change the format to “MMMM” or “dddd”.