FlexPivot allows you to format the information contained in the pivot grid. It lets you format and represent numeric data in various formats and apply conditional formatting to a cell or range of cells in pivot grid. The following sections describe these formatting in detail.
FlexPivot provides the option to format and represent numeric data in various formats such as number, currency, scientific, and percentage. You can also use custom format so that the numbers appears the way you want. The formatting can be done at runtime or through code as described in the following sections.
| Number | Formats the data as a number such as 1,235. You can specify the number of decimal places, and whether to use thousand separator (,) or not. |
| Currency | Formats the data as currency. You can specify the number of decimal places. |
| Percentage | Formats the data as percentage. You can specify the number of decimal places. |
| Scientific | Formats the data in scientific notation. You can specify the number of decimal places. |
| Custom | Applies a custom format to the data. |
You can format numeric data programmatically using the Format property and standard numeric format strings. Following enlisted are the accepted format strings that can be used in code.
| "N" or "n" | Numeric | Formats data as h numbers such as 1,k235. You can specify the number of decimal places and whether to use thousand separator (,) or not. |
| "C" or "c" | Currency | Formats the data as currency. You can specify the number of decimal places. |
| "P" or "p" | Percentage | Formats the data as percentage. You can specify the number of decimal places. |
| "E" or "e" | Scientific | Formats the data in scientific notation. You can specify the number of decimal places. |
| Non-standard numeric strings | Custom | Apply a custom format to the data. |
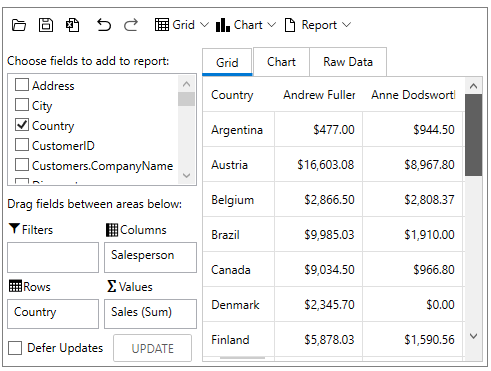
The following code showcases how you can format numeric data in Currency format.
| C# |
Copy Code
|
|---|---|
//formatting numeric data in code var field = fpEngine.Fields["ExtendedPrice"]; field.Format = "c"; |
|
Conditional formatting enables users to highlight cells with a certain color, depending upon the cell's value. The FlexPivotGrid control lets users apply conditional formatting to an individual cell or a range of cells to let them visualize data more clearly for analysis and comparison. The FlexPivotGrid class extends this functionality from the OwnerDraw feature of the FlexGrid class.
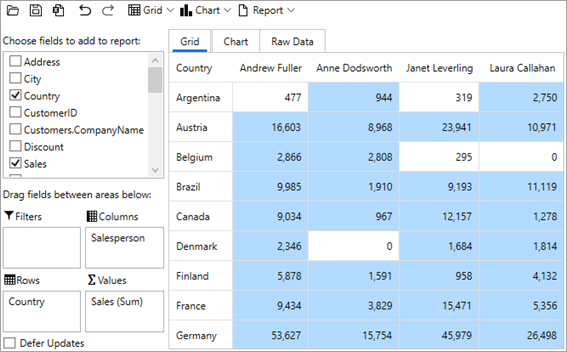
The FlexPivotGrid control derives from the FlexGrid control, so you can use the grid’s custom cells features to apply styles to cells based on their contents. The following image shows a grid where cells with values greater than 100 appear with a pastel blue background on conditional formatting. To achieve this output, use the code given below.
The FlexPivotGrid control has a CellFactory class that is responsible for creating every cell shown on the grid. To create custom cells, you have to create a class that implements the ICellFactory interface and assign this class to the grid's CellFactory property. Like custom columns, custom ICellFactory classes can be highly specialized and application-specific, or they can be general, reusable, configurable classes. In general, custom ICellFactory classes are a lot simpler than custom columns since they deal directly with cells.
To apply conditional formatting to the FlexPivotGrid cells, follow the steps given below. This implementation uses the sample created in Quick Start topic.
| C# |
Copy Code
|
|---|---|
//Inheriting GridCellFactory class to render custom cells or apply conditional formatting public class ConditionalCellFactory : GridCellFactory { public override void PrepareCell(GridCellType cellType, GridCellRange range, GridCellView cell) { base.PrepareCell(cellType, range, cell); // apply green background if necessary if (cellType == GridCellType.Cell) { var cellValue = Grid[range.Row, range.Column]; if (cellValue is double && (double)cellValue > 500) { cell.Background = blueBrush; } } } static Brush blueBrush = new SolidColorBrush(Color.FromArgb(0xff, 179, 218, 255)); } |
|
| C# |
Copy Code
|
|---|---|
//Apply conditional formatting to grid cells //Or render custom cells flexPivotPage.FlexPivotGrid.CellFactory = new ConditionalCellFactory(); |
|