FlexSheet for WPF | ComponentOne
Customizing Appearance / Using Floating Objects / Inserting Charts
In This Topic
    Inserting Charts
    In This Topic

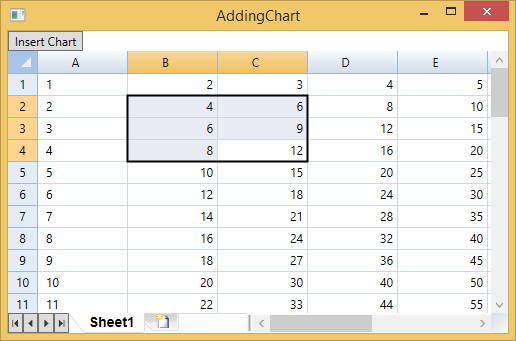
    The data in C1FlexSheet can be visualized using Charts. To visualize the data in charts, you need to add data to a sheet in C1FlexSheet.
    Follow the given steps in XAML to add data to a sheet and visualize it in chart:

    1. Add the following namespace declaration in the Window tag:
      XAML
      Copy Code
      xmlns:c1="http://schemas.componentone.com/winfx/2006/xaml"
      

    2. Copy the following code inside Grid tag to add C1FlexSheet control and a button control to insert a chart:
      XAML
      Copy Code
          <Grid.RowDefinitions>
              <RowDefinition Height="Auto"/>
              <RowDefinition/>
      </Grid.RowDefinitions>
          <c1:C1FlexSheet Name="flex" Grid.Row="1" HorizontalAlignment="Left" VerticalAlignment="Top"/>
          <Button Content="Insert Chart" Name="btnInsertchart" Click="btnInsertchart_Click" HorizontalAlignment="Left" Width="75"/>
      

    3. Right-click Design view and select View Code from the context menu.
    4. Add the following namespaces at the top:
      Imports C1.WPF
      Imports C1.WPF.FlexGrid
      Imports C1.WPF.C1Chart
      
      using C1.WPF;
      using C1.WPF.FlexGrid;
      using C1.WPF.C1Chart;
      
    5. Insert the following code directly below the InitializeComponent() method to add a sheet and data in it:
      'adding Sheet
      flex.AddSheet("Sheet1", 50, 10)
      
      ' populate the grid with some formulas (multiplication table)
      For r As Integer = 0 To flex.Rows.Count - 3
          Dim datas As New List(Of Double)()
          For c As Integer = 0 To flex.Columns.Count - 1
              flex(r, c) = String.Format("={0}*{1}", r + 1, c + 1)
              Dim value As Double = CDbl(flex(r, c))
              datas.Add(value)
          Next
      
      //adding Sheet
      flex.AddSheet("Sheet1", 50, 10);
      
      // populate the grid with some formulas (multiplication table)
      for (int r = 0; r < flex.Rows.Count - 2; r++)
      {
          List<double> datas = new List<double>();
          for (int c = 0; c < flex.Columns.Count; c++)
          {
              flex[r, c] = string.Format("={0}*{1}", r + 1, c + 1);
              double value = (double)flex[r, c];
              datas.Add(value);
          }
      }
      

    6. Go back to the Design view and select Event handlers of btnInsertchart from the Properties windows.
    7. Double-click the btnInsertchart_Click event handler.
      The Code view will open again.
    8. Add the following code to the btnInsertchart_Click event handler to insert a chart on button click:
      If Math.Abs(flex.Selection.RightColumn - flex.Selection.LeftColumn) > 0 AndAlso
         Math.Abs(flex.Selection.BottomRow - flex.Selection.TopRow) > 0 AndAlso
         flex.Selection.IsValid Then
          Dim c1Chart1 As New C1Chart()
          c1Chart1.Data.Children.Clear()
          For row As Integer = flex.Selection.TopRow To flex.Selection.BottomRow
              Dim datas As New List(Of Double)()
              For col As Integer = flex.Selection.LeftColumn To flex.Selection.RightColumn
                  Dim value As Object = flex(row, col)
                  If value IsNot Nothing AndAlso value.[GetType]().IsNumeric() Then
                      Dim cellValue As Double = CDbl(value)
                      datas.Add(cellValue)
                  End If
              Next
              ' create single series for product price
              Dim ds As New DataSeries()
              'set data
              ds.ValuesSource = datas
              ' add series to the chart
              c1Chart1.Data.Children.Add(ds)
          Next
      
          ' add item names
          'c1Chart1.Data.ItemNames = ProductNames;
          ' Set chart type
          c1Chart1.ChartType = ChartType.Bar
          flex.InsertChart(c1Chart1)
      Else
          MessageBox.Show("Please select more data")
      End If
      
      if (Math.Abs(flex.Selection.RightColumn - flex.Selection.LeftColumn) > 0
        && Math.Abs(flex.Selection.BottomRow - flex.Selection.TopRow) > 0
        && flex.Selection.IsValid)
      {
          C1Chart c1Chart1 = new C1Chart();
          c1Chart1.Data.Children.Clear();
          for (int row = flex.Selection.TopRow; row <= flex.Selection.BottomRow; row++)
          {
              List<double> datas = new List<double>();
              for (int col = flex.Selection.LeftColumn; col <= flex.Selection.RightColumn; col++)
              {
                  object value = flex[row, col];
                  if (value != null && value.GetType().IsNumeric())
                  {
                      double cellValue = (double)value;
                      datas.Add(cellValue);
                  }
              }
              // create single series for product price
              DataSeries ds = new DataSeries();
              //set data
              ds.ValuesSource = datas;
              // add series to the chart
              c1Chart1.Data.Children.Add(ds);
          }
      
          // add item names
          //c1Chart1.Data.ItemNames = ProductNames;
          // Set chart type
          c1Chart1.ChartType = ChartType.Bar;
          flex.InsertChart(c1Chart1);
      }
      else
      {
          MessageBox.Show("Please select more data");
      }
      

    9. Run the application.
    10. Select a range of data in cells to display it in form of charts:

      Selecting data for chart

    11. Click Insert Chart button.

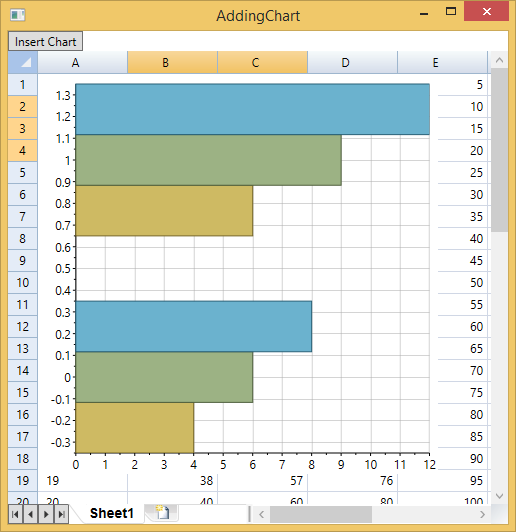
      The chart displayed on the basis of selected data looks similar to the image given below:
      Chart