One of the main strengths in OLAP applications is interactivity. Users must be able to create and modify views easily and quickly see the results. OLAP for WPF and Silverlight enables this with its Excel-like user interface and user friendly, simple dialogs.
But in some cases you may want to configure views using code. OLAP for WPF and Silverlight enables this with its simple yet powerful object model, especially the Field and Filter classes.
The example that follows shows how you can configure a view on load with OLAP for WPF and Silverlight.
| Visual Basic |
Copy Code
|
|---|---|
' show sales by customer and category Dim olap = _c1OlapPage.OlapPanel.OlapEngine olap.DataSource = ds.Tables(0).DefaultView olap.BeginUpdate() olap.RowFields.Add("Country") olap.ColumnFields.Add("Category") olap.ValueFields.Add("Sales") olap.Fields("Sales").Format = "n0" olap.EndUpdate() |
|
| C# |
Copy Code
|
|---|---|
// show sales by customer and category var olap = _c1OlapPage.OlapPanel.OlapEngine; olap.DataSource = ds.Tables[0].DefaultView; olap.BeginUpdate(); olap.RowFields.Add("Country"); olap.ColumnFields.Add("Category"); olap.ValueFields.Add("Sales"); olap.Fields["Sales"].Format = "n0"; olap.EndUpdate(); |
|
The code first calls the BeginUpdate method which suspends automatic updates to the output table. It adds fields for the Row, Column and Value field collections so that the user does not have to do this action. We could therefore, hide the C1OlapPanel portion of our application. This code also applies a numeric format to the “Sales” field, and finally calls the EndUpdate method.
If you run the sample now, you will see an OLAP view similar to the first example.
Next, let’s use the OLAP for WPF and Silverlight object model to change the format used to display the order dates and extended prices:
| Visual Basic |
Copy Code
|
|---|---|
' format order date Dim field = olap.Fields("OrderDate") field.Format = "yyyy" ' format extended price and change the Subtotal type ' to show the average extended price (instead of sum) field = olap.Fields("Sales") field.Format = "c" field.Subtotal = C1.Olap.Subtotal.Average |
|
| C# |
Copy Code
|
|---|---|
// format order date var field = olap.Fields["OrderDate"]; field.Format = "yyyy"; // format extended price and change the Subtotal type // to show the average extended price (instead of sum) field = olap.Fields["Sales"]; field.Format = "c"; field.Subtotal = C1.Olap.Subtotal.Average; |
|
The code retrieves the individual fields from the Fields collection which contains all the fields specified in the data source. Then it assigns the desired values to the Format and Subtotal properties. Format takes a regular .NET format string, and Subtotal determines how values are aggregated for display in the OLAP view. By default, values are added, but many other aggregate statistics are available including average, maximum, minimum, standard deviation, and variance.
Now suppose you are interested only in a subset of the data, say a few products and one year. A user would right-click the fields and apply filters to them. You can do the exact same thing in code as shown below:
| Visual Basic |
Copy Code
|
|---|---|
' format order date and extended price ' no changes… ' apply value filter to show only a few products Dim filter As C1.Olap.C1OlapFilter = olap.Fields("Product").Filter filter.Clear() filter.ShowValues = "Chai,Chang,Geitost,Ikura".Split(","C) ' apply condition filter to show only some dates filter = olap.Fields("OrderDate").Filter filter.Clear() filter.Condition1.[Operator] = C1.Olap.ConditionOperator.GreaterThanOrEqualTo filter.Condition1.Parameter = New DateTime(1996, 1, 1) filter.Condition2.[Operator] = C1.Olap.ConditionOperator.LessThanOrEqualTo filter.Condition2.Parameter = New DateTime(1996, 12, 31) filter.AndConditions = True |
|
| C# |
Copy Code
|
|---|---|
// format order date and extended price // no changes… // apply value filter to show only a few products C1.Olap.C1OlapFilter filter = olap.Fields["Product"].Filter; filter.Clear(); filter.ShowValues = "Chai,Chang,Geitost,Ikura".Split(','); // apply condition filter to show only some dates filter = olap.Fields["OrderDate"].Filter; filter.Clear(); filter.Condition1.Operator = C1.Olap.ConditionOperator.GreaterThanOrEqualTo; filter.Condition1.Parameter = new DateTime(1996, 1, 1); filter.Condition2.Operator = C1.Olap.ConditionOperator.LessThanOrEqualTo; filter.Condition2.Parameter = new DateTime(1996, 12, 31); filter.AndConditions = true; |
|
The code starts by retrieving the C1OlapFilter object that is associated with the “Product” field. Then it clears the filter and sets its ShowValues property. This property takes an array of values that should be shown by the filter. In OLAP for WPF and Silverlight we call this a “value filter”.
Next, the code retrieves the filter associated with the “OrderDate” field. This time, we want to show values for a specific year. But we don’t want to enumerate all days in the target year. Instead, we use a “condition filter” which is defined by two conditions.
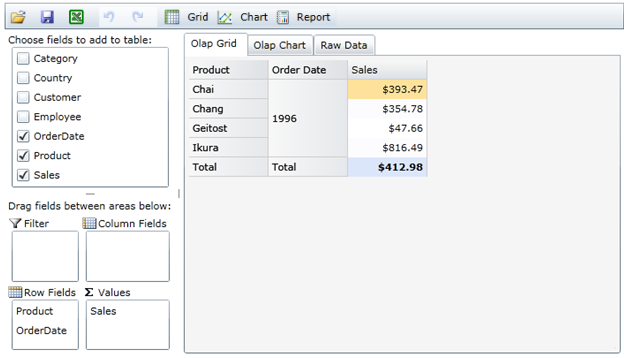
The first condition specifies that the “OrderDate” should be greater than or equal to January 1st, 1996. The second condition specifies that the “OrderDate” should be less than or equal to December 31st, 1996. The AndConditions property specifies how the first and second conditions should be applied (AND or OR operators). In this case, we want dates where both conditions are true, so AndConditions is set to true.
If you run the project again, you should see the following: