Run the application and you will see an interface similar to the one in Microsoft Excel. Drag the “Country” field to the “Row Fields” list and “Sales” to the “Values” list and you will see a summary of prices charged by country as shown below:
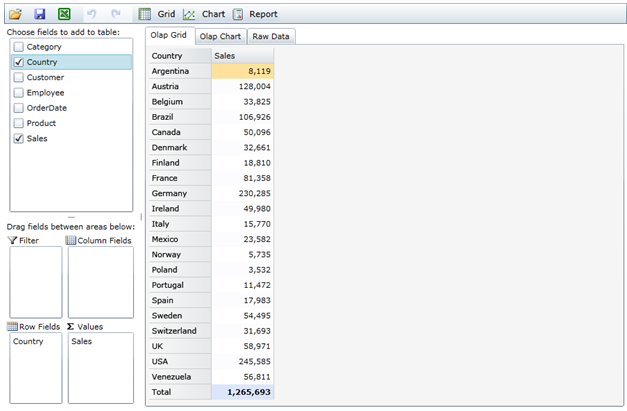
Click the “Olap Chart” tab and you will see the same data in chart format, showing that the main customers are the US, Germany, and Austria.
Now drag the “Category” field into the “Column Fields” list to see a new summary, this time of sales per country and per category. If you still have the chart tab selected, you should be looking at a chart similar to the previous one, except this time the bars are split to show how much was sold by each salesperson:
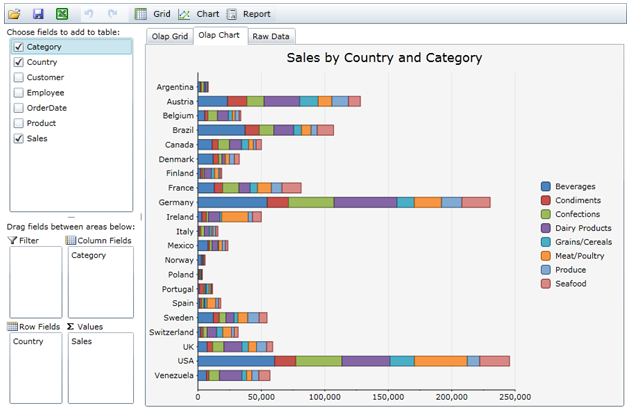
Move the mouse over the chart and you will see tooltips that show the name of the category and the amount sold when you hover over the chart elements.
Now create a new view by swapping the “Category” and “Country” fields by dragging them to the opposite lists. This will create a new chart that emphasizes category instead of country:
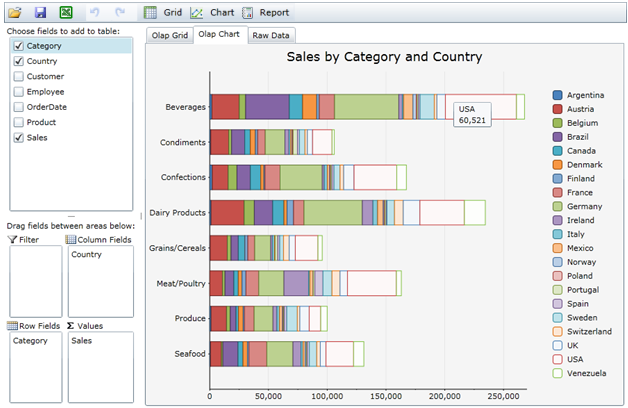
The chart shows that Beverages was the top selling category in the period being analyzed, followed closely by Dairy Products.
As we make changes to the view, the C1OlapPanel control keeps record. We can simply click the undo button in the C1OlapPanel menu to go back to a previous view we created.