Let’s create a new view to illustrate how you can easily summarize data in different ways.
This time, drag the “Employee” field to the “Row Fields” list and the “OrderDate” field to the “Column Fields” list. The resulting view contains one column for each day when an order was placed. This is not very useful information, because there are too many columns to show any trends clearly. We would like to summarize the data by month or year instead.
One way to do this would be to modify the source data, either by creating a new query in SQL or by using LINQ. Both of these techniques will be described in later sections. Another way is simply to modify the parameters of the “OrderDate” field. To do this, right-click the “OrderDate” field and select the “Field Settings” menu. Then select the “Format” tab in the dialog, choose the “Custom” format, enter “yyyy”, and click OK.
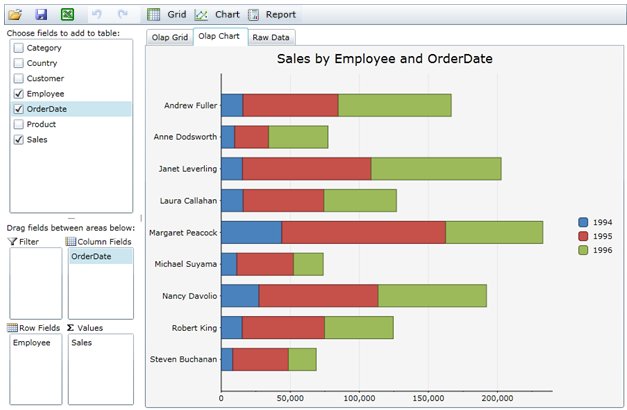
The dates are now formatted and summarized by year, and the OLAP chart looks like this:
If you wanted to check how sales are placed by month or weekday, you could simply change the format to “MMMM” or “dddd”.