Using Cube Data Sources
In This Topic
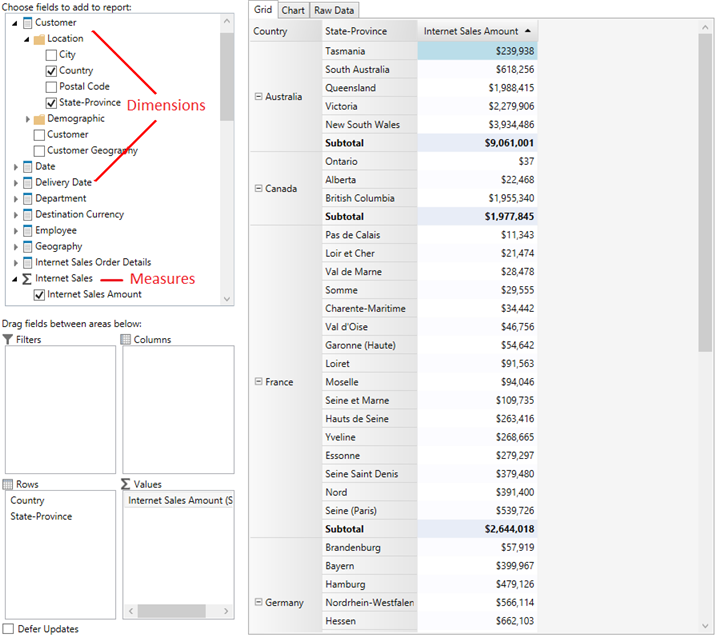
At run-time users can build reports from cube data much like they would from regular data sets. The key difference is that cube data sets are represented by a tree in the C1OlapPanel control with each node representing a dimensional entity or an object for measure. All fields that can be added to the report are displayed with a checkbox. Objects represented by the summation symbol (∑) are measures and can be added to the Values collection. Fields of entities can be added to the Rows or Columns collections.