Chart fields are implemented using the C1Chart control.
Note: You must deploy the C1Chart assembly with your application if you use charts.
To add a Chart field to your report, complete the following steps:
-
Open the report in the C1ReportDesigner application.
-
Click the Add Chart Field button in the toolbar, and mark the area in the report where the Chart should be displayed.
-
Then set the field properties as usual.
The only unusual aspect of Chart fields is that unlike most bound fields, they display multiple values. To select the data you want to display, set the Chart field's Chart.DataX and Chart.DataY properties. To format the values along the X and Y axis, set the Chart.FormatX and Chart.FormatY properties. You can also customize the chart appearance by setting other properties such as Chart.ChartType, Chart.Palette, and so on.
To create a new report with an embedded chart, use the C1Report Wizard. Complete the following steps:
-
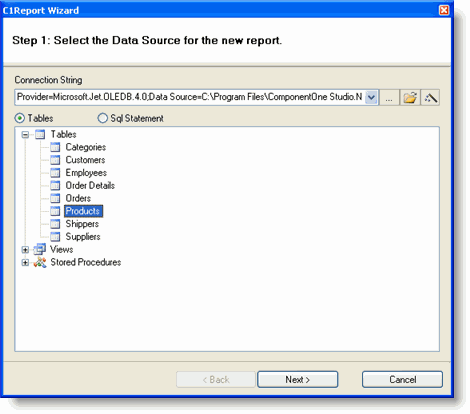
Select the data source for the new report.
-
Click the Build a connection string ellipses button (…). The Data Link Properties dialog box appears.
-
Select the Provider tab and then select Microsoft Jet 4.0 OLE DB Provider from the list.
-
Click Next.
-
In the Connection page, click the ellipsis button to browse for the Nwind.mdb database.
-
This is the standard Visual Studio Northwind database. By default, the database is installed in the samples directory.
-
Select the Tables radio button, and then select the Sales by Category view. The following image shows this step:
-
-
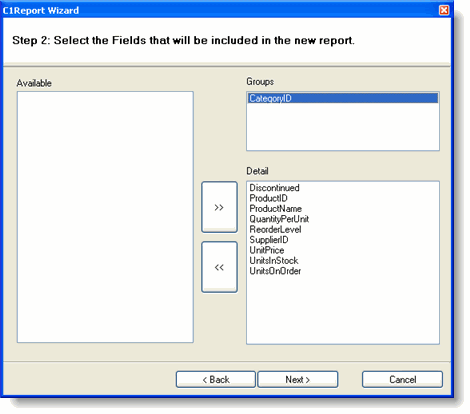
Select the fields you want to display.
This example groups the data by Category and show ProductName and ProductSales in the Detail section of the report: To add groups and detail fields, with your mouse pointer drag them from the Available list on the left to the Groups or Detail lists on the right:
Continue clicking Next until the wizard is done. The wizard creates the initial version of the report.
-
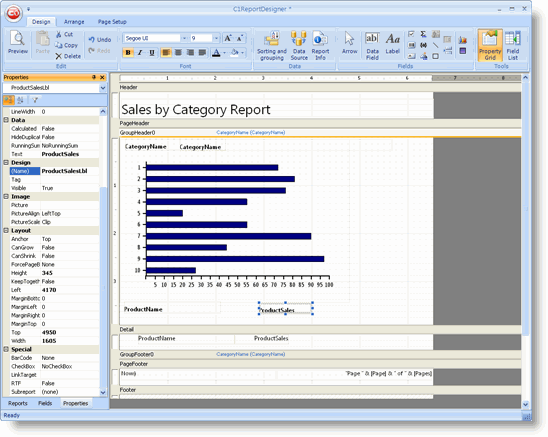
Add the Chart to the Group Header section of the report.
Charts usually make sense in the Group Header sections of a report, to summarize the information for the group. To add the chart to the Group Header section:
-
Click the Close Print Preview button in the Close Preview group to switch to Design mode to begin editing the report.
-
Expand the Group Header Section by performing a drag-and-drop operation with the section's borders.
-
Then click the Add Chart Field button in the Fields group of the Design tab and place the field in the report in the Group Header Section.
-
Resize the chart by clicking and dragging the chart field.
-
From the Properties window, set the Chart.DataY property to the name of the field that contains the values to be charted, in this case, ProductSales.
-
Note that the Chart.DataY property may specify more than one chart series. Just add as many fields or calculated expressions as you want, separating them with semicolons.
-
Also set the Chart.DataX property to the name of the field that contains the labels for each data point, in this case, ProductName.
-
From the Properties window, set the Chart.FormatY property to "#,###" to set the values along the axis to thousand-separated values.
The Chart control will now display some sample data so you can see the effect of the properties that are currently set (the actual data is not available at design time). You may want to experiment changing the values of some properties such as Chart.ChartType, Chart.DataColor, and Chart.GridLines. You can also use the regular field properties such as Font and ForeColor.
Your report should look similar to the following report:
Click the Preview button to see the report and click the Next page button to scroll through the report to view the Chart field for each group. The sample report should look like the following image:
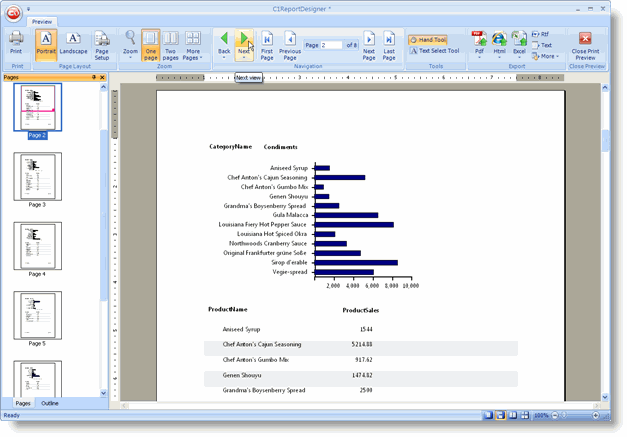
Note that the Report field is sensitive to its position in the report. Because it is in a Group Header section, it only includes the data within that group. If you place the Chart field in a Detail section, it will include all the data for the entire report. This is not useful because there will be one chart in each Detail section and they will all look the same. If you need more control over what data should be displayed in the chart, you can use the DataSource property in the chart field itself.
You can now save the report and use it in your WinForms and ASP.NET applications.