An axis is a horizontal or vertical line that displays measurement units while plotting a sparkline. It serves as a reference for the data points in sparkline. The Sparkline control supports an x-axis, which can either be displayed or kept hidden as per the user requirements. This topic discusses various properties that can be applied to Axis in the Sparkline control.
By default, the Sparkline control renders without any axis. However, at times, there may be a need to display the horizontal axis, i.e., x-axis, to better visualize values greater than and less than zero. To display x-axis, you can set DisplayXAxis property of the C1Sparkline class to true.
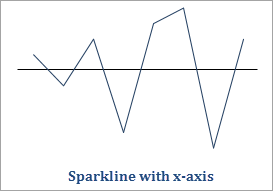
The following code shows how to display the x-axis in Sparkline.
Sparkline supports a date axis to plot data over a span of dates on x-axis. The date axis is nothing but a type of x-axis that allows users to display data at irregular intervals. It takes a collection of dates that acts as x-coordinates and plots data accordingly. This way it allows users to plot data over a span of dates.
For example, consider a scenario where the user wants to display the following monthly sales profit figures as a trend. In this example, the negative values in the following table indicate loss.
| Dates | Sales Profit (in Hundred Thousands) |
|---|---|
| 01-01-2016 | 1.0 |
| 15-01-2016 | -2.0 |
| 01-02-2016 | -1.0 |
| 03-03-2016 | 6.0 |
| 06-04-2016 | 4.0 |
| 11-06-2016 | -4.0 |
| 19-07-2016 | 3.0 |
| 01-09-2016 | 8.0 |
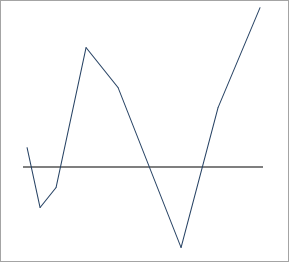
The C1Sparkline class provides DisplayDateAxis property, which if set to true, displays data over a span of dates. Here is how the Sparkline control plots data at irregular intervals.
To configure the date axis, you can use an enumerable collection of dates as x-coordinates and assign it to the DateAxisData property. Follow the steps below to set and display date axis in Sparkline as shown in the following image.
This example uses the sample that you created in the Quick start section.
Add the following code to the SampleData.cs class that you created in the Quick Start to create an enumerable collection of dates.
| C# |
Copy Code
|
|---|---|
public List<DateTime> DefaultDateAxisData { get { List<DateTime> dates = new List<DateTime>(); dates.Add(new DateTime(2016, 1, 1)); dates.Add(new DateTime(2016, 1, 15)); dates.Add(new DateTime(2016, 2, 1)); dates.Add(new DateTime(2016, 3, 3)); dates.Add(new DateTime(2016, 4, 6)); dates.Add(new DateTime(2016, 6, 11)); dates.Add(new DateTime(2016, 7, 19)); dates.Add(new DateTime(2016, 9, 1)); return dates; } } |
|
Switch to the MainWindow.xaml.cs file, and add the following code to assign the date collection to the sparkline using the DateAxisData property.
| C# |
Copy Code
|
|---|---|
sparkline.DateAxisData = sampleData.DefaultDateAxisData;
sparkline.DisplayXAxis = true;
|
|