You can add multiple Y axes simultaneously to the FlexChart control by creating a new object of Axis type and customizing its properties. This feature allows you to add two series in a single FlexChart instance with same X axis but different Y axis. In order to further customize the appearance, users can choose to differentiate the two series by selecting different chart types.
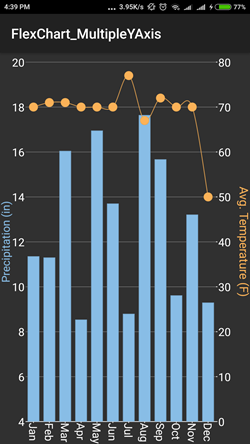
The image below shows a FlexChart control with a common X axis that displays months, and left and right Y axes that display two different series elements Precipitation and Temperature, respectively.
The following steps demonstrate how to add multiple Y axes for FlexChart control.
Add ChartPoint.cs class as a data source that fetches random data for the two series as shown below.
| C# |
Copy Code |
|---|---|
class ChartPoint : Java.Lang.Object { static Random random = new Random(); private String month; private double precipitation; private int temperature; public string Month { get { return month; } set { month = value; } } public double Precipitation { get { return precipitation; } set { precipitation = value; } } public int Temperature { get { return temperature; } set { temperature = value; } } public ChartPoint(String month, double precipitation, int temperature) { this.Month = month; this.Precipitation = precipitation; this.Temperature = temperature; } // a method to create a list of random objects of type ChartPoint public static IList<object> GetList() { //ObservableCollection<ChartPoint> list = new ObservableCollection<ChartPoint>(); List<object> list = new List<object>(); int n = 6; // number of series elements String[] countries = { "US", "Germany", "UK", "Japan", "Italy", "Greece", "India", "Canada" }; for (int i = 0; i < n; i++) { list.Add(new ChartPoint(countries[i], random.Next(20000), random.Next(20000), random.Next(20000))); } return list; } } | |
Now, add the following code to MainActivity.cs file to initialize a FlexChart control and series elements and bind them with the data source.
| C# |
Copy Code |
|---|---|
public class MainActivity : Activity { //int count = 1; private FlexChart mChart; protected override void OnCreate(Bundle savedInstanceState) { base.OnCreate(savedInstanceState); // Set our view from the "main" layout resource SetContentView(Resource.Layout.Main); // initializing widget mChart = this.FindViewById<FlexChart>(Resource.Id.flexChart1); mChart.LegendPosition = ChartPositionType.None; // set the binding for X-axis of FlexChart mChart.BindingX = "Month"; // initialize series elements and set the binding to variables of // ChartPoint ChartSeries seriesPrecipitation = new ChartSeries(); seriesPrecipitation.Chart = mChart; seriesPrecipitation.SeriesName = "Precipitation"; seriesPrecipitation.Binding = "Precipitation"; ChartSeries seriesTemperature = new ChartSeries(); seriesTemperature.Chart = mChart; seriesTemperature.SeriesName = "Temperature"; seriesTemperature.Binding = "Temperature"; // add series to list mChart.Series.Add(seriesPrecipitation); mChart.Series.Add(seriesTemperature); // setting the source of data/items and default values in FlexChart mChart.ItemsSource = GetList(); seriesTemperature.ChartType = ChartType.SplineSymbols; // format y-axis properties set in XMl layout mChart.AxisY.Title = "Precipitation (in)"; // mChart.AxisY.TitleFontSize(15); mChart.AxisY.MajorUnit = 2; mChart.AxisY.TitleStyle = new ChartStyle(); mChart.AxisY.TitleStyle.Stroke = Color.ParseColor("#88bde6"); mChart.AxisY.AxisLine = false; mChart.AxisY.Min = 4; mChart.AxisY.Max = 20; // create a new axis and customize it ChartAxis axisYRight = new ChartAxis(); axisYRight.Chart = mChart; axisYRight.Position = ChartPositionType.Right; axisYRight.Title = "Avg. Temperature (F)"; axisYRight.TitleStyle = new ChartStyle(); axisYRight.TitleStyle.FontSize = 15; axisYRight.AxisLine = false; axisYRight.MajorGrid = false; axisYRight.MinorGrid = false; axisYRight.MajorUnit = 10; axisYRight.Min = 0; axisYRight.Max = 80; axisYRight.TitleStyle.Stroke = Color.ParseColor("#fbb258"); mChart.AxisX.LabelAngle = 90; // tie the series to the axis seriesTemperature.AxisY = axisYRight; } // a method to create a list of random objects of type ChartPoint private static IList<object> GetList() { IList<object> list = new List<object>(); int n = 12; // number of series elements String[] month = { "Jan", "Feb", "Mar", "Apr", "May", "Jun", "Jul", "Aug", "Sep", "Oct", "Nov", "Dec" }; Random random = new Random(); for (int i = 0; i < n; i++) { ChartPoint point = new ChartPoint(month[i], random.Next(8, 18) + random.NextDouble(), (int)Math.Tan(i * i) + 70); list.Add(point); } return list; } } | |
In the Package Explorer, right-click your application and click Run As | Android Application.