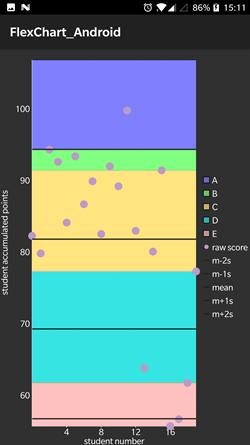
FlexChart allows you to create and apply colored regions called zones on the chart. These colored zones categorize the data points plotted on the chart into regions, making it easier for the user to read and understand the data. Users can easily identify the category in which a particular data point lies.
To explain how zones can be helpful, consider a score report of a class that aims at identifying the score zone under which the maximum number of students fall and how many students score above 90. This scenario can be realized in FlexChart by plotting scores as data points in chart and categorizing them in colored zones using area chart, separated by line type data series as follows:
In FlexChart, zones can be created as data series available through the ChartSeries class. Each zone can be created as area charts by setting the ChartType property to Line, highlighted in distinct colors.
Complete the following steps to create zones in FlexChart.
| CS |
Copy Code |
|---|---|
public class ZonesData : Java.Lang.Object { public int Number { get; set; } public double Score { get; set; } public ZonesData(int Number, double Score) { this.Number = Number; this.Score = Score; } // a method to create a list of zones sample objects of type ChartPoint public static IList<object> getZonesList(int nStudents, int nMaxPoints) { List<object> list = new List<object>(); Random random = new Random(); for (int i = 0; i < nStudents; i++) { ZonesData point = new ZonesData(i, nMaxPoints * 0.5 * (1 + random.NextDouble())); list.Add(point); } return list; } } | |
| CS |
Copy Code |
|---|---|
public class MainActivity : Activity { private FlexChart mChart; protected override void OnCreate(Bundle savedInstanceState) { base.OnCreate(savedInstanceState); // Set our view from the "main" layout resource SetContentView(Resource.Layout.Main); // initializing widget mChart = this.FindViewById<FlexChart>(Resource.Id.flexchart); mChart.BindingX = "Number"; mChart.ChartType = ChartType.Scatter; int nStudents = 20; int nMaxPoints = 100; IList<object> data = ZonesData.getZonesList(nStudents, nMaxPoints); mChart.ItemsSource = data; mChart.Tapped += MChart_Tapped; mChart.AxisX.Title = "student number"; mChart.AxisY.Title = "student accumulated points"; double mean = this.FindMean(data); double stdDev = this.FindStdDev(data, mean); List<double> scores = new List<double>(); foreach (ZonesData item in data) { scores.Add(item.Score); } scores.Sort((x, y) => y.CompareTo(x)); var zones = new double[] { scores[this.GetBoundingIndex(scores, 0.85)], scores[this.GetBoundingIndex(scores, 0.75)], scores[this.GetBoundingIndex(scores, 0.25)], scores[this.GetBoundingIndex(scores, 0.05)] }; Integer[] colors = new Integer[] { new Integer(Color.Argb(255,255,192,192)), new Integer(Color.Argb(255,55,228,228)), new Integer(Color.Argb(255,255,228,128)), new Integer(Color.Argb(255,128,255,128)), new Integer(Color.Argb(255,128,128,255)), }; for (var i = 4; i >= 0; i--) { float y = (float)(i == 4 ? mean + 2 * stdDev : zones[i]); PointF[] sdata = new PointF[data.Count]; for (int j = 0; j < data.Count; j++) { sdata[j] = new PointF(j, y); if (i == 0) { System.Console.WriteLine(j + "=" + y); } } string seriesName = ((char)((short)'A' + 4 - i)).ToString(); var series = new ChartSeries(); series.Chart = mChart; series.SeriesName = seriesName; series.Binding = "Y"; series.ItemsSource = sdata; series.BindingX = "X"; series.ChartType = ChartType.Area; series.Style = new ChartStyle(); series.Style.Fill = new Color(colors[i].IntValue()); mChart.Series.Add(series); } ChartSeries scoreSeries = new ChartSeries(); scoreSeries.Chart = mChart; scoreSeries.SeriesName = "raw score"; scoreSeries.Binding = "Score"; mChart.Series.Add(scoreSeries); for (var i = -2; i <= 2; i++) { var y = mean + i * stdDev; string seriesName = string.Empty; if (i > 0) { seriesName = "m+" + i + "s"; } else if (i < 0) { seriesName = "m" + i + "s"; } else { seriesName = "mean"; } PointF[] sdata = new PointF[data.Count]; for (int j = 0; j < data.Count; j++) { sdata[j] = new PointF(j, (float)y); } var series = new ChartSeries(); series.Chart = mChart; series.SeriesName = seriesName; series.Binding = "Y"; series.ItemsSource = sdata; series.BindingX = "X"; series.ChartType = ChartType.Line; series.Style = new ChartStyle(); series.Style.StrokeThickness = 2; series.Style.Stroke = Color.Rgb(0x20, 0x20, 0x20); mChart.Series.Add(series); } } private double FindMean(IList<object> data) { double sum = 0; foreach (ZonesData item in data) { sum += item.Score; } return sum / data.Count; } private double FindStdDev(IList<object> data, double mean) { double sum = 0; for (var i = 0; i < data.Count; i++) { ZonesData item = (ZonesData)data[i]; var d = item.Score - mean; sum += d * d; } return System.Math.Sqrt(sum / data.Count); } private int GetBoundingIndex(List<double> scores, double frac) { var n = scores.Count; int i = (int)System.Math.Ceiling(n * frac); while (i > scores[0] && scores[i] == scores[i + 1]) i--; return i; } private void MChart_Tapped(object sender, C1TappedEventArgs e) { if (!mChart.ToolTip.Text.Contains("raw score")) { mChart.ToolTip.IsOpen = false; } } } | |