You can bind the FlexChart control to data by setting its BindingX property (for X-axis values), and Binding property (for Y-axis values)on each Series that you add to the control. The FlexChart control and the ChartSeries class provides the same set of properties for data binding as mentioned in the following table.
| Property Name | Description |
|---|---|
| Binding | Property for binding Y-axis values |
| BindingX | Property for binding X-axis values |
| ItemsSource | Property for binding with collection of items |
Users can set the ItemsSource and BindingX properties on the FlexChart control, and the Binding property on each series. The ChartSeries uses parent chart values in case these properties are not specified on the series level.
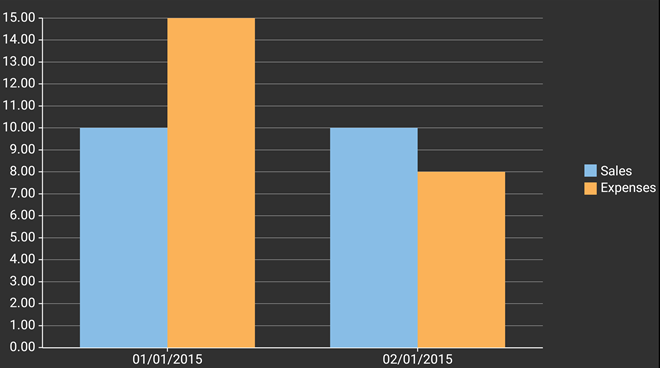
The image given below shows data binding in the FlexChart control. The X-axis is bound to DateTime while the Y-axis is bound to Sales and Expenses values for the corresponding DateTime.
To implement and observe this feature, we use a new data source file and make some changes in the QuickStart class that we used earlier.
The following code examples illustrate how to set Data Binding in FlexChart control. The example uses the sample created in the Quick Start section with slight changes as described below.
| C# |
Copy Code
|
|---|---|
public class FlexChartDataSource { public string Name { get; set; } public double Sales { get; set; } public double Expenses { get; set; } public double Downloads { get; set; } public DateTime Date { get; set; } public FlexChartDataSource() { this.Name = string.Empty; this.Sales = 0; this.Expenses = 0; this.Downloads = 0; this.Date = DateTime.Now; } public FlexChartDataSource(string name, double sales, double expenses, double downloads, DateTime date) { this.Name = name; this.Sales = sales; this.Expenses = expenses; this.Downloads = downloads; this.Date = date; } } |
|
| C# |
Copy Code
|
|---|---|
chart.BindingX = "Time"; chart.Series.Add(new ChartSeries() { Binding = "Sales", Name = "Sales" }); chart.Series.Add(new ChartSeries() { Binding = "Expenses", Name = "Expenses" }); chart.ItemsSource = new object[] { new {Time=new DateTime(2015,1,1), Sales=10, Expenses = 15}, new {Time=new DateTime(2015,2,1), Sales=10, Expenses=8} }; |
|
You can also set the Binding through XAML as mentioned in the following code snippet.
| XAML |
Copy Code
|
|---|---|
<c1:FlexChart x:Name="chart" ItemsSource="{Binding FlexChartDataSource}" BindingX="Time"> <c1:FlexChart.Series> <c1:ChartSeries Binding="Sales" Name="Sales" /> <c1:ChartSeries Binding="Expenses" Name="Expenses" /> </c1:FlexChart.Series> </c1:FlexChart> |
|