You can add multiple axes to the FlexChart control and customize its properties. This feature allows you to add two series in a single FlexChart instance with same X axis but different Y axis. In order to further customize the appearance, users can choose to differentiate the two series by selecting different chart types.
The image below shows a FlexChart control with a common X axis that displays months, and left and right Y axes that displays two different series for Temperature and Precipitation, respectively.
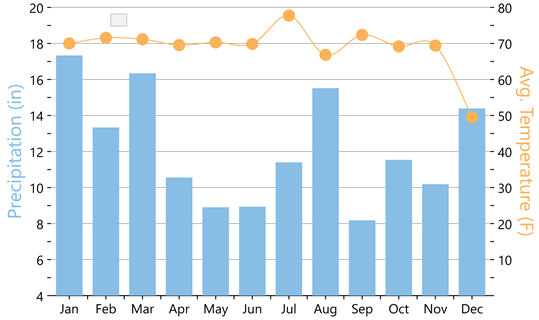
The following steps demonstrate how to add multiple Y axes in the FlexChart control.
| XAML |
Copy Code
|
|---|---|
<ContentPage xmlns="http://xamarin.com/schemas/2014/forms" xmlns:x="http://schemas.microsoft.com/winfx/2009/xaml" xmlns:c1="clr-namespace:C1.Xamarin.Forms.Chart;assembly=C1.Xamarin.Forms.Chart" x:Class="QuickstartChart.MultipleYAxes"> <c1:FlexChart x:Name="flexChart" BindingX="MonthName"> <c1:FlexChart.Series> <c1:ChartSeries Binding="Precipitation" SeriesName="Precip"/> <c1:ChartSeries Binding="Temp" ChartType="SplineSymbols" SeriesName="Avg. Temp"> <c1:ChartSeries.AxisY> <c1:ChartAxis Position="Right" Min="0" Max="80" MajorUnit="10" Title="Avg.Temperature (F)" AxisLine="False" MajorGrid="False"> <c1:ChartAxis.TitleStyle> <c1:ChartStyle Stroke="#fbb258" FontSize="20"/> </c1:ChartAxis.TitleStyle> </c1:ChartAxis> </c1:ChartSeries.AxisY> </c1:ChartSeries> </c1:FlexChart.Series> <c1:FlexChart.AxisY> <c1:ChartAxis Min="4" Max="20" MajorUnit="2" MajorGrid="True" Title="Precipitation (in)" AxisLine="False"> <c1:ChartAxis.TitleStyle> <c1:ChartStyle Stroke="#88bde6" FontSize="20"/> </c1:ChartAxis.TitleStyle> </c1:ChartAxis> </c1:FlexChart.AxisY> </c1:FlexChart> </ContentPage> |
|
| C# |
Copy Code
|
|---|---|
public partial class MultipleYAxes : ContentPage { public MultipleYAxes() { InitializeComponent(); this.flexChart.ItemsSource = GetWeatherData(); this.flexChart.LegendPosition = ChartPositionType.None; } public IEnumerable<WeatherData> GetWeatherData() { List<WeatherData> weatherData = new List<WeatherData>(); string[] monthNames = new string[] { "Jan", "Feb", "Mar", "Apr", "May", "Jun", "Jul", "Aug", "Sep", "Oct", "Nov", "Dec" }; //double[] tempData = new double[] { 24, 30, 45, 58, 68, 75, 83, 80, 72, 62, 47, 32 }; Random random = new Random(); for (int i = 0; i < monthNames.Length; i++) { WeatherData wd = new WeatherData(); wd.MonthName = monthNames[i]; wd.Precipitation = random.Next(8, 18) + random.NextDouble(); wd.Temp = Math.Tan(i * i) + 70; weatherData.Add(wd); } return weatherData; } } public class WeatherData { public string MonthName { get; set; } public double Temp { get; set; } public double Precipitation { get; set; } } |
|