Annotations are used to mark important news or events that can be attached to a specific data point on FlexChart. Annotations can also be used to place arbitrary elements such as images, shapes and text onto the chart. The FlexChart control supports various built-in annotations such as Polygon, Line, Ellipsis, Rectangle, Image and Text.
You can specify the position of an annotation on FlexChart by setting the Position property to Bottom, Center, Left, Right or Top. To specify the type of annotation on FlexChart, you can use the Content property and set its value to:
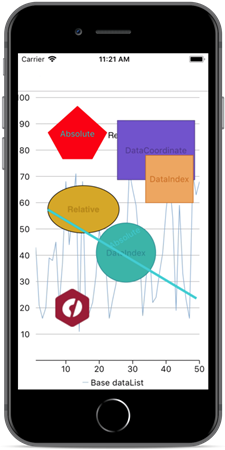
The following image shows how FlexChart control appears after applying annotations to it.
Complete the following steps to apply annotations to the FlexChart control:
| C# |
Copy Code
|
|---|---|
using System;using System.Collections.Generic;using UIKit;using CoreGraphics;using C1.iOS.Chart;using C1.iOS.Chart.Annotation;using CoreText; |
|
| C# |
Copy Code
|
|---|---|
public class AnnotationViewModel { List <DataItem> _data; List <DataItem> _simpleData; Random rnd = new Random(); public List <DataItem> Data { get { if (_data == null) { _data = new List < DataItem > (); for (int i = 1; i < 51; i++) { _data.Add(new DataItem() { X = i, Y = rnd.Next(10, 100) }); } } return _data; } } public List <DataItem> SimpleData { get { if (_simpleData == null) { _simpleData = new List <DataItem> (); _simpleData.Add(new DataItem() { X = 1, Y = 30 }); _simpleData.Add(new DataItem() { X = 2, Y = 20 }); _simpleData.Add(new DataItem() { X = 3, Y = 30 }); _simpleData.Add(new DataItem() { X = 4, Y = 65 }); _simpleData.Add(new DataItem() { X = 5, Y = 70 }); _simpleData.Add(new DataItem() { X = 6, Y = 60 }); } return _simpleData; } } } public class DataItem { public int X { get; set; } public int Y { get; set; } } public partial class AnnotationController: UIViewController { FlexChart chart; public AnnotationController(): base("AnnotationController", null) {} public AnnotationController(IntPtr handle): base(handle) { } public override void ViewDidLoad() { base.ViewDidLoad(); // Perform any additional setup after loading the view, typically from a nib. chart = new FlexChart(); chart.LegendPosition = ChartPositionType.Bottom; chart.ChartType = ChartType.Line; chart.BindingX = "X"; chart.Series.Add(new ChartSeries() { SeriesName = "Base dataList", Binding = "Y,Y" }); chart.ItemsSource = new AnnotationViewModel().Data; this.Add(chart); Text text = new Text() { Content = "Relative", Location = new CGPoint(0.5, 0.5), Attachment = AnnotationAttachment.Relative }; text.AnnotationStyle = new ChartStyle() { FontSize = 15, Stroke = UIColor.Black, FontFamily = UIFont.FromName("GenericSansSerif", 15) }; Ellipse ellipse = new Ellipse() { Content = "Relative", Location = new CGPoint(0.4, 0.45), Width = 120, Height = 80, Attachment = AnnotationAttachment.Relative }; ellipse.AnnotationStyle = new ChartStyle() { Fill = UIColor.FromRGBA(0.85 f, 0.65 f, 0.12 f, 1.0 f), Stroke = UIColor.FromRGBA(0.75 f, 0.55 f, 0.06 f, 1.0 f), FontFamily = UIFont.ItalicSystemFontOfSize(10) }; Circle circle = new Circle() { Content = "DataIndex", Radius = 50, SeriesIndex = 0, PointIndex = 27, Attachment = AnnotationAttachment.DataIndex }; circle.AnnotationStyle = new ChartStyle() { Fill = UIColor.FromRGBA(0.17 f, 0.70 f, 0.67 f, 1.0 f), Stroke = UIColor.FromRGBA(0.13 f, 0.58 f, 0.58 f, 1.0 f), FontFamily = UIFont.BoldSystemFontOfSize(10) }; Rectangle rectangle = new Rectangle() { Content = "DataCoordinate", Width = 130, Height = 100, Location = new CGPoint(37, 80), Attachment = AnnotationAttachment.DataCoordinate }; rectangle.AnnotationStyle = new ChartStyle() { Fill = UIColor.FromRGBA(0.42 f, 0.35 f, 0.80 f, 1.0 f), Stroke = UIColor.FromRGBA(0.29 f, 0.25 f, 0.57 f, 1.0 f), FontFamily = UIFont.BoldSystemFontOfSize(10) }; Square square = new Square() { Content = "DataIndex", Length = 80, SeriesIndex = 0, PointIndex = 40, Attachment = AnnotationAttachment.DataIndex }; square.AnnotationStyle = new ChartStyle() { Fill = UIColor.FromRGBA(0.96 f, 0.64 f, 0.38 f, 1.0 f), Stroke = UIColor.FromRGBA(0.89 f, 0.54 f, 0.25 f, 1.0 f), FontFamily = UIFont.BoldSystemFontOfSize(10) }; Polygon polygon = new Polygon() { Content = "polygonAnno", Attachment = AnnotationAttachment.Absolute }; polygon.Points = CreatePoints(); polygon.AnnotationStyle = new ChartStyle() { Fill = UIColor.Red, StrokeThickness = 3, Stroke = UIColor.FromRGBA(0.98 f, 0.06 f, 0.05 f, 1.0 f), FontFamily = UIFont.BoldSystemFontOfSize(10) }; Line line = new Line() { Content = "Absolute", Start = new CGPoint(50, 200), End = new CGPoint(300, 350), Attachment = AnnotationAttachment.Absolute }; line.AnnotationStyle = new ChartStyle() { StrokeThickness = 4, FontSize = 10, FontAttributes = CTFontSymbolicTraits.Bold, Stroke = UIColor.FromRGBA(0.20 f, 0.81 f, 0.82 f, 1.0 f), FontFamily = UIFont.BoldSystemFontOfSize(10) }; Image image = new Image() { Location = new CGPoint(12, 20), Attachment = AnnotationAttachment.DataCoordinate }; image.Source = new UIImage("Images/xuni_butterfly.png"); AnnotationLayer layer = new AnnotationLayer(); layer.Annotations.Add(text); layer.Annotations.Add(ellipse); layer.Annotations.Add(circle); layer.Annotations.Add(rectangle); layer.Annotations.Add(square); layer.Annotations.Add(polygon); layer.Annotations.Add(line); layer.Annotations.Add(image); chart.Layers.Add(layer); } private System.Collections.ObjectModel.ObservableCollection <CGPoint> CreatePoints() { System.Collections.ObjectModel.ObservableCollection <CGPoint> points = new System.Collections.ObjectModel.ObservableCollection <CGPoint>(); points.Add(new CGPoint(100, 25)); points.Add(new CGPoint(50, 70)); points.Add(new CGPoint(75, 115)); points.Add(new CGPoint(125, 115)); points.Add(new CGPoint(150, 70)); return points; } public override void ViewDidLayoutSubviews() { base.ViewDidLayoutSubviews(); chart.Frame = new CGRect(this.View.Frame.X, this.View.Frame.Y + 80, this.View.Frame.Width, this.View.Frame.Height - 80); } |
|