An axis is composed of several elements, such as labels, line, tick marks and titles. There are several properties available in FlexChart that let you customize these elements, for both X and Y axes. For more information, see standard format strings available in .Net for more information.
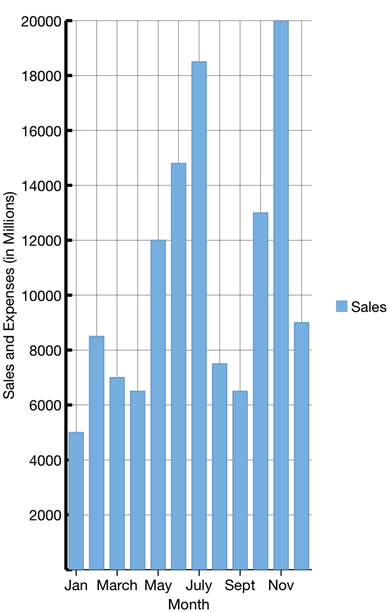
The image below shows a FlexChart with customized axes.
The following code example demonstrates how to customize the axes. The example uses the sample created in the Customize Appearance section.
| C# |
Copy Code
|
|---|---|
chart.AxisY.AxisLine = true; chart.AxisY.MajorGrid = true; chart.AxisY.Style.StrokeThickness = 3; chart.AxisY.Title = "Sales and Expenses (in Millions)"; chart.AxisY.MajorTickMarks = ChartTickMarkType.Inside; chart.AxisY.MajorUnit = 2000; chart.AxisX.AxisLine = true; chart.AxisX.MajorGrid = true; chart.AxisX.Style.Fill = UIColor.Blue; chart.AxisX.Title = "Month"; chart.AxisX.MajorGridStyle.Fill = UIColor.Blue; |
|
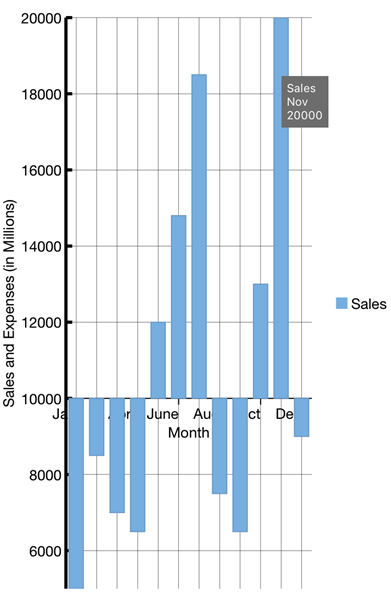
Users can customize the FlexChart's axis origin to plot data points in all the four quadrants. Use AxisX.Origin and AxisY.Origin properties to set the origin for both the axes at a particular point. This is useful in scenarios in trend analysis, where a user wants to plot positive as well as negative values on the chart. With axis origin set to zero, the negative values are plotted below the horizon and positive values above it. This provides better visualization to a user for data analysis on the chart.
The image given below shows how the FlexChart appears when its X axis origin is set to 1000.
The following code example illustrates how to customize the X-axis origin. This example uses the sample created in Customize Appearance section. Similarly, you can set the value of Y-axis as well, to display the values in first and fourth quadrants.
| C# |
Copy Code
|
|---|---|
//Set axis X origin
chart.AxisX.Origin = 10000;
|
|