Creating a Tree Column
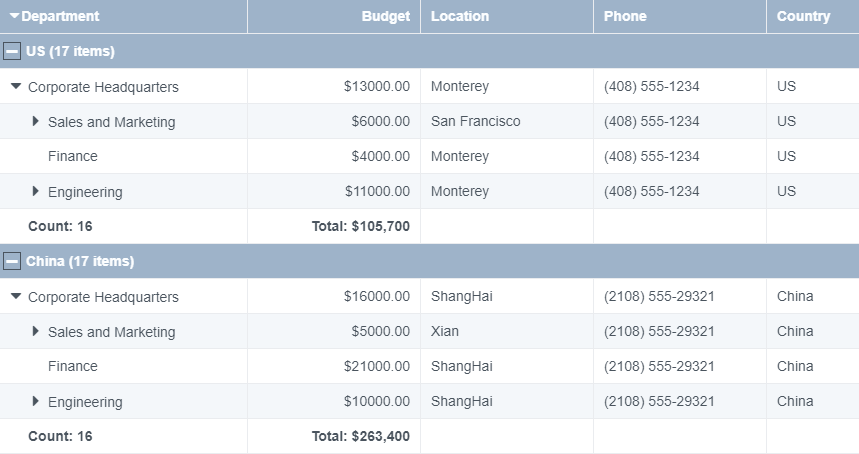
DataViewsJS allows you to display hierarchical data in a grid using a tree column presenter. While using a tree column presenter, the parent grid is displayed when the page is loaded; however, the child grid is only visible when you click the + plus sign or press the right arrow key.
The following descriptors are used in a grid to build data items as a tree.
- parentField: Stores the parent of each data record.
- keyField: This is a unique property. This property is used to find the parent item.
- column Specifies which column the tree will be applied
Tree column can be work with group, no matter it works with group or not, the tree grid policy is as following, items whose parent field value is null, undefined or '' (empty string) will be treated as root nodes, for other items, if the parent filed is specified and there is no item whose key filed value is equal to the specified parent value, the item will not be shown in the control since root is not existing, maybe it will look strange when work with group, based on the group and hirarchy settings, there could be some bottom level groups shows they have child items but no item shows actually, that is because the root node is absent in that group.
Use the following steps to create a tree column presenter. notice that these steps shows how it work with group, tree column can work alone without grouping also.
Sample Code
- Add the column definition. Also set the hierarchyFooter property for the column to which the tree view is to be applied.
// column definitions
var columns = [
  {
    id: 'department',
    caption: 'Department',
    dataField: 'department',
    width: 250,
    hierarchyFooter: '<span style="font-weight:bold">Count: \{{=it.eval("=COUNT([id])")}}</span>',
  },
  {
    id: 'budget',
    caption: 'Budget',
    dataField: 'budget',
    format: '$0.00',
    minWidth: 120,
    hierarchyFooter: '<span style="font-weight:bold">Total: \{{=it.eval("=SUM([budget])", "$0,0")}}</span>',
  },
  {
    id: 'location',
    caption: 'Location',
    dataField: 'location',
    minWidth: 120,
  },
  {
    id: 'phone',
    caption: 'Phone',
    dataField: 'phone',
    minWidth: 120,
  },
  {
    id: 'country',
    caption: 'Country',
    dataField: 'country',
    minWidth: 120,
  },
  {
    id: 'id',
    caption: 'Id',
    dataField: 'id',
    visible: false,
  },
  {
    id: 'parent',
    caption: 'Parent',
    dataField: 'parent',
    visible: false,
  },
];
- Set the grouping and hierarchy properties while initializing the grid. Add a function to expand the nodes manually.
Note: The tree column can also be implemented without using the grouping feature.
var dataView = new GC.DataViews.DataView(
  document.getElementById('grid1'),
  data,
  columns,
  new GC.DataViews.GridLayout({
    allowSorting: true,
    showRowHeader: false,
    grouping: [
      {
        field: 'country',
        footer: {
          visible: false,
        },
      },
    ],
    hierarchy: {
      keyField: 'id',
      parentField: 'parent',
      collapsed: true,
      column: 'department',
      footer: {
        visible: true,
      },
    },
  })
);
See also
Feedback
Submit and view feedback for