Data Visualization
Data visualization is the representation of data using common graphics such as charts, shapes, pictures, barcodes, and slicers. These information visualizations convey complex data relationships and data-driven insights in an easy-to-understand manner. With the professional license, DsDataViewer supports the display of charts, shapes, pictures, barcodes, and slicers.
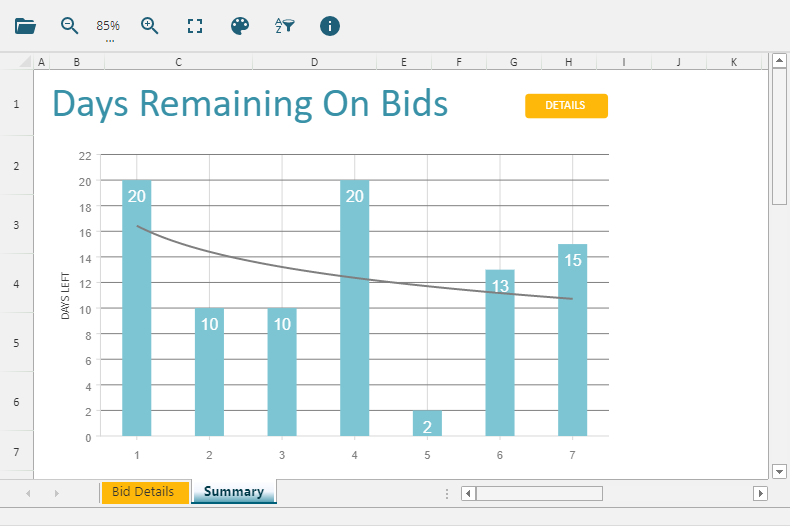
Charts
Charts help you visualize your data and allow you to graphically illustrate your workbook data, making it easy to visualize comparisons and trends. The DsDataViewer supports the display of charts in Excel XLSX and SpreadJS (SSJSON and .sjs) files. It also supports display of pivot chart and chart sheet in an Excel XLSX file. However, they are displayed as normal charts with no interaction (filter) on the pivot chart.
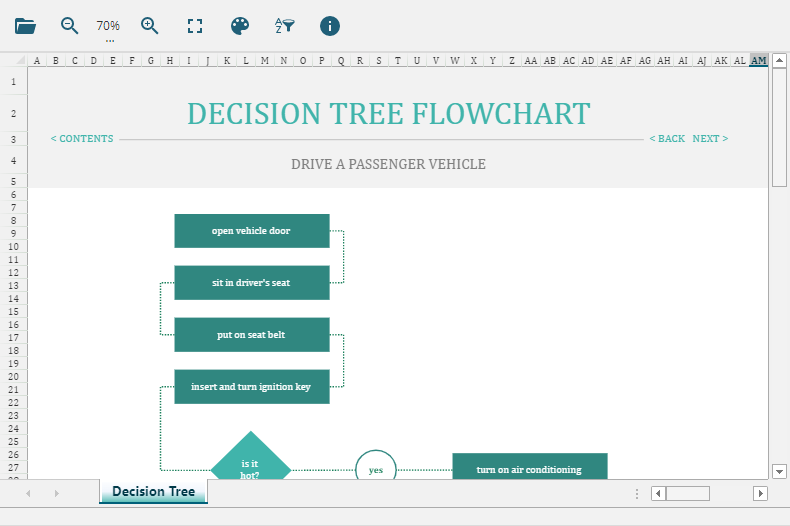
Shapes
Shapes add visualizations to your dashboards and store text. The DsDataViewer supports the display of shapes in Excel XLSX and SpreadJS (SSJSON and .sjs) files. If the shape has a link, the user can click and navigate to the destination.
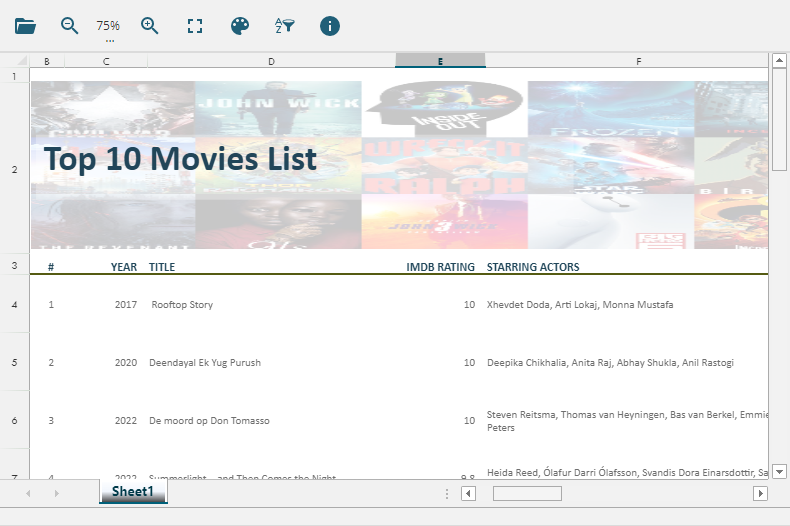
Pictures
Pictures in a worksheet are a simple way to display information or add visual interest. The DsDataViewer supports the display of pictures in Excel XLSX and SpreadJS (SSJSON and .sjs) files. If the picture has a link, the user can click and navigate to the destination.
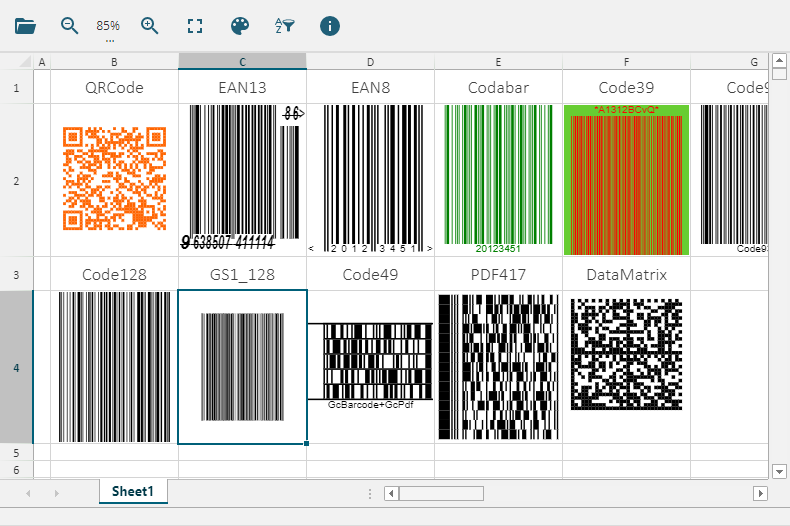
Barcodes
A barcode is a digital code that looks like a collection of black bars and white spaces and stores machine-readable information. The DsDataViewer supports the display of barcodes created using SpreadJS barcode formulas in an SSJSON or .sjs file. For more information on SpreadJS barcode formulas, see Barcodes.
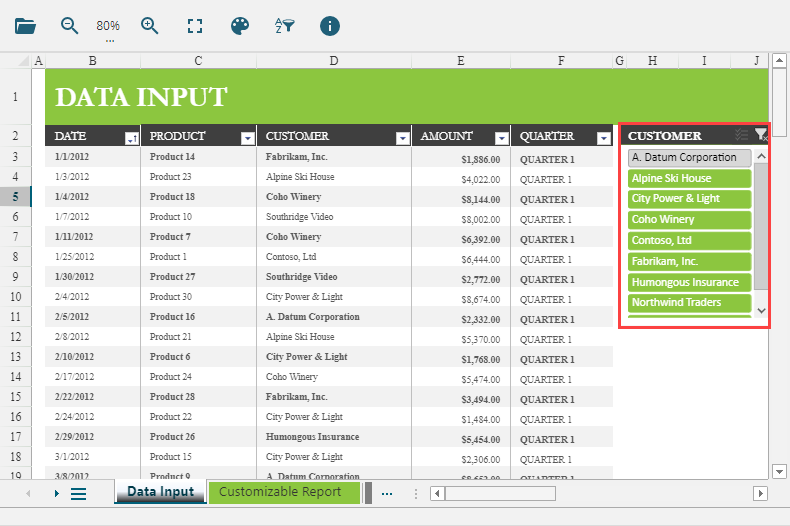
Slicers
Slicers provide buttons you can click to filter Tables or Pivot Tables. Slicers not only perform quick filtering but also display the filtering state, making it simple to understand what is being displayed at any given time. The DsDataViewer supports the display of slicers in an Excel file.
Slicers allow you to filter the Table and Pivot Table data by clicking on the Slicer items. You can also select multiple items by holding Ctrl or by clicking on the Multi-Select ( ) button. Slicers also provide a Clear Filter (
 ) button that allows you to clear all the filters at once.