
Sorting and Filtering
DsDataViewer provides Sort & Filter button ( ) in the toolbar that allows you to sort and filter the data in a range or Table, and change the order of your data, or focus on a specific set of data. This button is supported with the Professional License of DsDataViewer.
Sorting
Data sorting is an essential part of data analysis. Sorting the data allows you to order and organize your data. You can arrange a list alphabetically, numerically, or for a color scale. It makes data searches easier and eventually leads to quick and effective decisions. In DsDataViewer, you can sort your data in a Table or range by:
Text and numbers using the sort options in the Sort & Filter button drop-down menu.
Text, number, and colors using the Filter dialog, which opens on clicking the Filter icon.
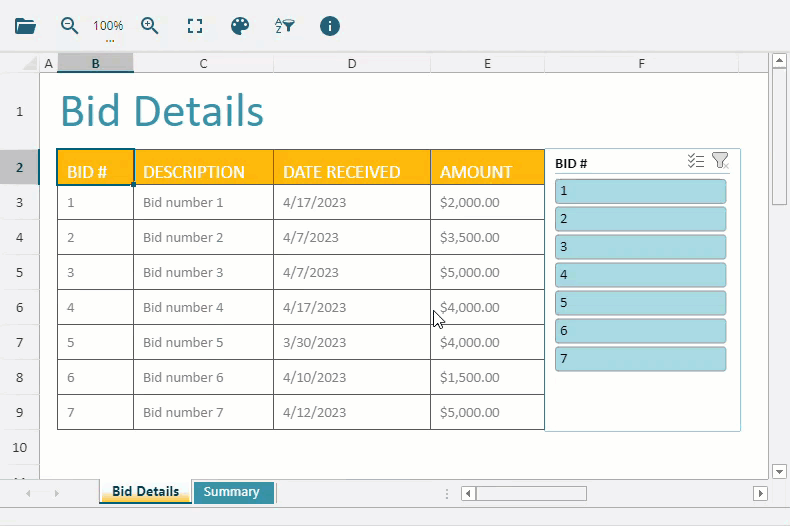
Sort Data Range
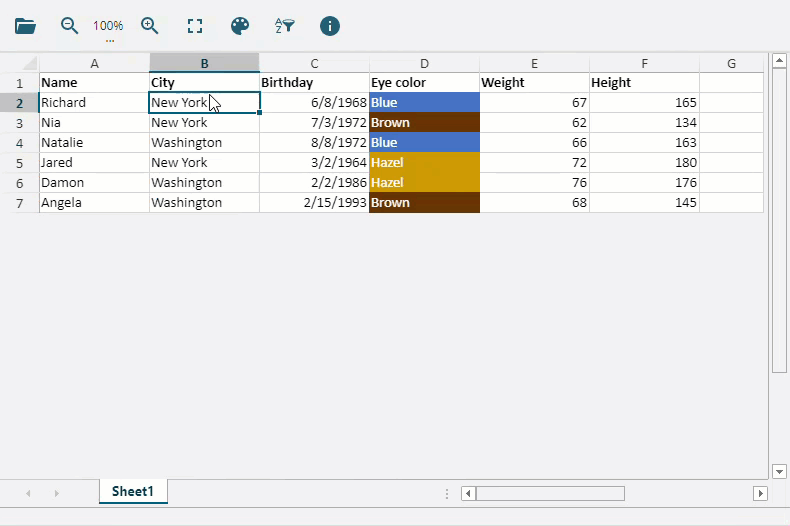
To sort data using Sort & Filter drop-down menu options, select a range and choose the desired sorting option. The data is sorted according to the column with the first selected cell.
To sort data using Filter dialog, click on the filter icon to open the dialog for a column in the selected range. Then choose the desired sorting option to sort data according to the selected column. To enable a filter icon for a range, select the range and click the Filter option in the Sort & Filter dropdown.
Note: The DsDataViewer will display the following error messages when sorting is applied to an empty selected range or multiple selected ranges, respectively:
This can't be applied to the selected range. Select a single cell in a range and try again.
This can't be done on a multiple-range selection. Select a single range and try again.
Sort Table Data
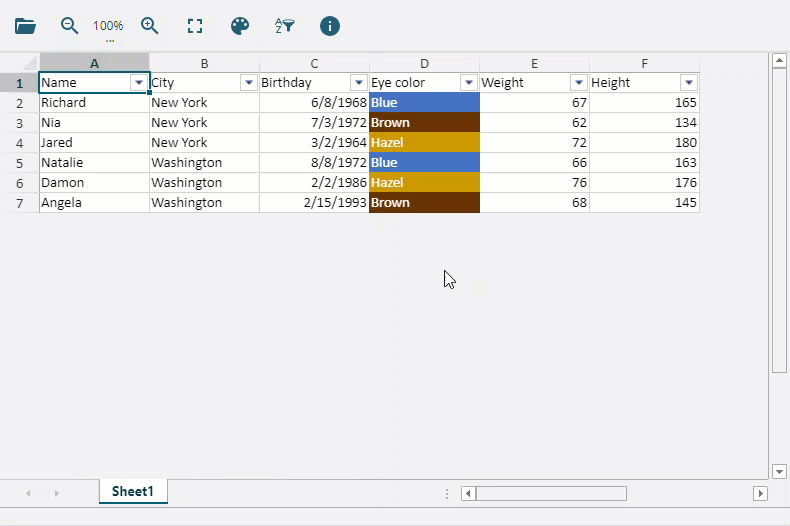
To sort data using Sort & Filter drop-down menu options, select a column or a cell in the Table and choose the desired sorting option. The data is sorted in the Table according to the selected column.

To sort data using the Filter dialog, click the filter icon in the header of a column to open the dialog and choose the desired sorting option. If the filter icon is not enabled for the Table, choose the Filter option from the Sort & Filter dropdown.
Filtering
Data filtering is an essential part of data analysis. It allows you to focus on specific information in a pool of data. It helps you control the display of relevant data by temporarily eliminating irrelevant entries from the view based on a specific criteria.
Auto Filter is a quick way to display only relevant information at a given time while hiding all other data. In DsDataViewer, you can filter your data in a Table or range by value, data type filter, custom criteria, and color using the Filter dialog. The Filters in DsDataViewer are additive, which means when the filter is applied to multiple columns in a range or Table, each succeeding filter is added to the previous one and reduces the subset of data even further.
Filter Data Range and Table
To filter data in a range or Table when:
Filter icon is available: Click the icon to choose desired filter option.
Filter icon is not available: Select the range or Table and enable the icon using the Filter option in Sort & Filter button drop-down menu. Open the Filter dialog and choose the desired filter option.
You can also use Slicers to filter the data in a Table or Pivot Table.
Note:
In the XLSX or SpreadJS (SSJSON and .sjs) file, the icon appears in the row before the selected range or in the grid decorator for the range starting at the first row.
When more than one range is selected, the Filter for the first range will be displayed or hidden.
For a Table, the icon appears in the header row. If the Table does not have a header, then Filter icon shows no effect. In CSV, the Filter icon is always added to the header row in the grid decorator for all columns.