Sparklines can be understood as small, lightweight charts that are drawn inside cells to quickly visualize data for improved analysis. These tiny charts fit inside a cell and use data from a range of cells which is specified at the time of creating it. Typically, they are placed next to the selected cell range in the spreadsheet in order to enhance readability of data. These are particularly useful for analytical dashboards, presentations, business reports etc.
A sparkline displays the most recent value as the rightmost data point and compares it with earlier values on a scale, allowing you to view general changes in data over time.
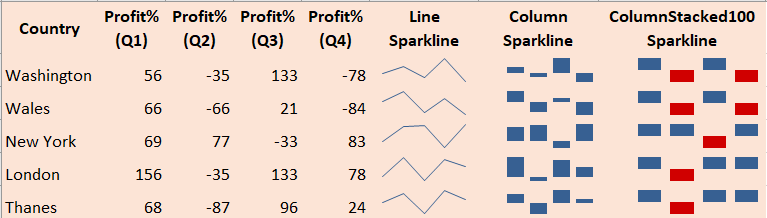
DsExcel Java allows you to highlight specific information and see how it varies over time using line, column, columnstacked100, and cascade sparklines. You can use add method of the ISparklineGroups interface to add line, column, or columnstacked100 sparklines using SparkType enumeration. However, cascade sparkline is added using CASCADESPARKLINE formula. For more information about cascade sparkline, see SpreadJS Sparklines.
Using sparklines includes the following tasks:
You can insert a group of new sparklines for each row or column of data in your worksheet by first specifying the data range and then using the add method of the ISparklineGroups interface and getSparklineGroups method of the IRange interface.
In order to insert a group of new sparklines, refer to the following example code.
| Java |
Copy Code |
|---|---|
// Create workbook and access its first worksheet Workbook workbook = new Workbook(); IWorksheet worksheet = workbook.getWorksheets().get(0); // Defining data in the range Object[][] data = new Object[][] { { 1, 2, 3 }, { 4, 5, 6 }, { 7, 8, 9 }, { 10, 11, 12 } }; // Add a group of new sparklines worksheet.getRange("A1:C4").setValue(data); worksheet.getRange("D1:D4").getSparklineGroups().add(SparkType.Line, "A1:C4"); | |
You can remove a sparkline from your worksheet via specifying the data range and then using the clear method of the ISparklineGroups interface.
In order to clear sparkline, refer to the following example code.
| Java |
Copy Code |
|---|---|
// Defining data in the range Object[][] data = new Object[][] { { 1, 2, 3 }, { 4, 5, 6 }, { 7, 8, 9 }, { 10, 11, 12 } }; worksheet.getRange("A1:C4").setValue(data); worksheet.getRange("D1:D4").getSparklineGroups().add(SparkType.Line, "A1:C4"); worksheet.getRange("F1:H4").setValue(data); // Add a group of new sparklines worksheet.getRange("J1:J4").getSparklineGroups().add(SparkType.Line, "F1:H4"); // Clear D2 and J1 cell's sparkline. worksheet.getRange("D2,J1").getSparklineGroups().clear(); | |
You can remove a group of sparklines (added for a row or column) from the spreadsheet via specifying the data range and then using the clearGroups method of the ISparklineGroups interface.
In order to clear sparkline groups, refer to the following example code.
| Java |
Copy Code |
|---|---|
// Defining data in the range Object[][] data = new Object[][] { { 1, 2, 3 }, { 4, 5, 6 }, { 7, 8, 9 }, { 10, 11, 12 } }; worksheet.getRange("A1:C4").setValue(data); // Add a group of new sparklines worksheet.getRange("D1:D4").getSparklineGroups().add(SparkType.Line, "A1:C4"); worksheet.getRange("F1:H4").setValue(data); worksheet.getRange("J1:J4").getSparklineGroups().add(SparkType.Line, "F1:H4"); // Clear sparkline groups worksheet.getRange("D2,J1").getSparklineGroups().clearGroups(); | |
You can create a group of existing sparklines in your worksheet via specifying the data range and then using the methods of the ISparklineGroups interface.
In order to create a group of existing sparklines, refer to the following example code.
| Java |
Copy Code |
|---|---|
// Defining data in the range Object[][] data = new Object[][] { { 1, 2, 3 }, { 4, 5, 6 }, { 7, 8, 9 }, { 10, 11, 12 } }; worksheet.getRange("A1:C4").setValue(data); worksheet.getRange("D1:D4").getSparklineGroups().add(SparkType.Line, "A1:C4"); worksheet.getRange("F1:H4").setValue(data); // Add a group of new sparklines worksheet.getRange("J1:J4").getSparklineGroups().add(SparkType.Column, "F1:H4"); // Create a new group, according to Range["J2"]'s sparkline group setting. worksheet.getRange("A1:J4").getSparklineGroups().group(worksheet.getRange("J2")); | |
You can add a group of new sparklines with date axis by first specifying the data range and then using the methods of the ISparklineGroups interface.
In order to add group of new sparkline with date axis, refer to the following example code.
| Java |
Copy Code |
|---|---|
// Defining data in the range Object[][] data = new Object[][] { { 1, 2, 3 }, { 4, 5, 6 }, { 7, 8, 9 }, { 10, 11, 12 } }; worksheet.getRange("A1:C4").setValue(data); // Add a group of new sparklines worksheet.getRange("D1:D4").getSparklineGroups().add(SparkType.Line, "A1:C4"); Object[] date_data = new Object[] { new GregorianCalendar(2011, 11, 16), new GregorianCalendar(2011, 11, 17), new GregorianCalendar(2011, 11, 18) }; worksheet.getRange("A7:C7").setValue(date_data); // Set horizontal axis's Date range. worksheet.getRange("D1").getSparklineGroups().get(0).setDateRange("A7:C7"); worksheet.getRange("D1").getSparklineGroups().get(0).getAxes().getHorizontal().getAxis().setVisible(true); worksheet.getRange("D1").getSparklineGroups().get(0).getAxes().getHorizontal().getAxis().getColor().setColor(Color.GetGreen()); worksheet.getRange("D1").getSparklineGroups().get(0).getAxes().getVertical().setMinScaleType(SparkScale.SparkScaleCustom); worksheet.getRange("D1").getSparklineGroups().get(0).getAxes().getVertical().setMaxScaleType(SparkScale.SparkScaleCustom); worksheet.getRange("D1").getSparklineGroups().get(0).getAxes().getVertical().setCustomMinScaleValue(-2); worksheet.getRange("D1").getSparklineGroups().get(0).getAxes().getVertical().setCustomMaxScaleValue(8); | |
You can configure the layout of the sparkline by using the methods of the ISparklineGroup interface.
In order to configure the layout of the sparkline, refer to the following example code.
| Java |
Copy Code |
|---|---|
// Defining data in the range Object[][] data = new Object[][] { { 1, 2, 3 }, { 4, 5, 6 }, { 7, 8, 9 }, { 10, 11, 12 } }; worksheet.getRange("A1:C4").setValue(data); // Adding sparkline worksheet.getRange("D1:D4").getSparklineGroups().add(SparkType.Line, "A1:C4"); // Defining source data Object[] date_data = new Object[] { new GregorianCalendar(2011, 11, 16), new GregorianCalendar(2011, 11, 17), new GregorianCalendar(2011, 11, 18) }; worksheet.getRange("A7:C7").setValue(date_data); // Configuring the layout ISparklineGroup sparklinegroup = worksheet.getRange("D1").getSparklineGroups().get(0); sparklinegroup.setLineWeight(2.5); sparklinegroup.getPoints().getMarkers().getColor().setColor(Color.GetRed()); sparklinegroup.getPoints().getMarkers().setVisible(true); sparklinegroup.getSeriesColor().setColor(Color.GetPurple()); | |