Pivot chart represents the data of associated pivot table in a chart. Like a normal chart, the pivot chart displays data series, categories, legends, data markers and axes. You can change the titles, legend placement, data labels, chart location etc.
A pivot chart is interactive as it reflects the changes made in its associated pivot table. The pivot table fields are displayed on a pivot chart as buttons. You can configure whether to display the legend, axis, value field buttons or expanding or collapsing entire field buttons by using the getPivotOptions method. When a field button is clicked, its filter pane appears. It helps you to sort and filter pivot chart's underlying data.
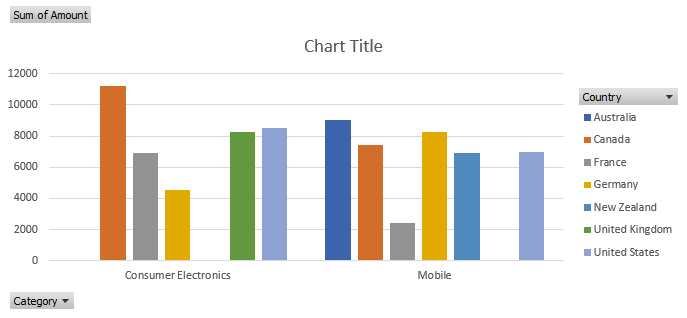
Excel files with pivot charts can be loaded, modified and saved back to Excel. The below image displays a pivot chart with legend, axis and value field buttons.
The below mentioned steps explain how to create a pivot chart:
| Java |
Copy Code |
|---|---|
//create a new workbook Workbook workbook = new Workbook(); Object sourceData = new Object[][]{ {"Order ID", "Product", "Category", "Amount", "Date", "Country"}, {1, "Bose 785593-0050", "Consumer Electronics", 4270, new GregorianCalendar(2018, 0, 6), "United States"}, {2, "Canon EOS 1500D", "Consumer Electronics", 8239, new GregorianCalendar(2018, 0, 7), "United Kingdom"}, {3, "Haier 394L 4Star", "Consumer Electronics", 617, new GregorianCalendar(2018, 0, 8), "United States"}, {4, "IFB 6.5 Kg FullyAuto", "Consumer Electronics", 8384, new GregorianCalendar(2018, 0, 10), "Canada"}, {5, "Mi LED 40inch", "Consumer Electronics", 2626, new GregorianCalendar(2018, 0, 10), "Germany"}, {6, "Sennheiser HD 4.40-BT", "Consumer Electronics", 3610, new GregorianCalendar(2018, 0, 11), "United States"}, {7, "Iphone XR", "Mobile", 9062, new GregorianCalendar(2018, 0, 11), "Australia"}, {8, "OnePlus 7Pro", "Mobile", 6906, new GregorianCalendar(2018, 0, 16), "New Zealand"}, {9, "Redmi 7", "Mobile", 2417, new GregorianCalendar(2018, 0, 16), "France"}, {10, "Samsung S9", "Mobile", 7431, new GregorianCalendar(2018, 0, 16), "Canada"}, {11, "OnePlus 7Pro", "Mobile", 8250, new GregorianCalendar(2018, 0, 16), "Germany"}, {12, "Redmi 7", "Mobile", 7012, new GregorianCalendar(2018, 0, 18), "United States"}, {13, "Bose 785593-0050", "Consumer Electronics", 1903, new GregorianCalendar(2018, 0, 20), "Germany"}, {14, "Canon EOS 1500D", "Consumer Electronics", 2824, new GregorianCalendar(2018, 0, 22), "Canada"}, {15, "Haier 394L 4Star", "Consumer Electronics", 6946, new GregorianCalendar(2018, 0, 24), "France"}, }; IWorksheet worksheet = workbook.getWorksheets().get(0); worksheet.getRange("A6:F21").setValue(sourceData); worksheet.getRange("D6:D21").setNumberFormat("$#,##0.00"); // Create pivot cache IPivotCache pivotcache = workbook.getPivotCaches().create(worksheet.getRange("A6:F21")); // Create pivot table IPivotTable pivottable = worksheet.getPivotTables().add(pivotcache, worksheet.getRange("A1"), "pivottable1"); //config pivot table's fields pivottable.getPivotFields().get("Category").setOrientation(PivotFieldOrientation.RowField); pivottable.getPivotFields().get("Country").setOrientation(PivotFieldOrientation.ColumnField); pivottable.getPivotFields().get("Amount").setOrientation(PivotFieldOrientation.DataField); worksheet.getRange("A:I").autoFit(); // Add a column chart IChart chart = worksheet.getShapes().addChartInPixel(ChartType.ColumnClustered, 0, 100, 689, 320).getChart(); // Set data source(use pivot table range). chart.setSourceData(pivottable.getTableRange1()); //save to an excel file workbook.save("CreatePivotChart.xlsx"); | |
Note: To turn a normal chart into a pivot chart, add any chart from the ones listed below. A NotSupportedException will be thrown if any other chart is added.
Refer to the following example code to configure pivot chart's buttons.
| Java |
Copy Code |
|---|---|
// Set not to show legend and axis buttons chart.getPivotOptions().setShowLegendFieldButtons(false); chart.getPivotOptions().setShowAxisFieldButtons(false); // Set legend position to bottom chart.getLegend().setPosition(LegendPosition.Bottom); | |
Refer to the following example code to update pivot table to reflect in pivot chart.
| Java |
Copy Code |
|---|---|
// Drag row field to hidden
chart.getPivotTable().getRowFields().get(0).setOrientation(PivotFieldOrientation.Hidden); | |
Refer to the following example code to convert pivot chart to normal chart.
| Java |
Copy Code |
|---|---|
// Clear pivot table to turn a PivotChart into a normal chart.
pivottable.getTableRange2().clear(); | |