A Radar chart is used to display circular visual representation of a 2-dimensional data. One can think of it as a circular XY chart. These charts represent each variable on a separate axis, which are arranged radially at equal distances from each other. Each of these axes share the same tick marks and scale. The data for each observation is plotted along these axis and then joined to form a polygon. Radar charts are generally used for analyzing performance or comparing values such as revenue and expense.
DsExcel supports the following types of radar charts.
| Chart Type | Chart Snapshot | Use Case |
|---|---|---|
| Radar |
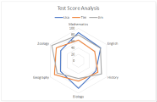
Radar chart |
Radar chart type can be used to represent multivariate data plotted in rows and columns in the graphical format. |
| RadarFilled |
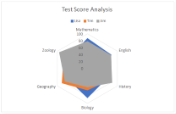
RadarFilled chart |
RadarFilled chart type can be used to display radar chart with areas highlighted by different colored regions for each value. |
| RadarMarkers |
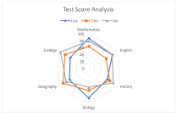
RadarMarkers chart |
RadarMarkers chart can be used to display radar chart with markers representing data for each value along with areas highlighted by different line colors. |
Refer to the following code to add RadarMarkers chart:
| Java |
Copy Code |
|---|---|
private static void RadarCharts() { // Initialize workbook Workbook workbook = new Workbook(); // Fetch default worksheet IWorksheet worksheet = workbook.getWorksheets().get(0); // Prepare data for chart worksheet.getRange("A1:D7") .setValue(new Object[][] { { null, "Lisa", "Tim", "Jim" }, { "Mathematics", 87, 64, 79 }, { "English", 79, 58, 78 }, { "History", 62, 70, 82 }, { "Biology", 85, 63, 54 }, { "Geography", 64, 85, 75 }, { "Zoology", 62, 79, 94 } }); worksheet.getRange("A:D").getColumns().autoFit(); // Add Radar Chart IShape radarChartShape = worksheet.getShapes().addChart(ChartType.Radar, 250, 20, 360, 230); // Adding series to SeriesCollection radarChartShape.getChart().getSeriesCollection().add(worksheet.getRange("A1:D7"), RowCol.Columns, true, true); // Configure Chart Title radarChartShape.getChart().getChartTitle().getTextFrame().getTextRange().getParagraphs() .add("Test Score Analysis"); // Saving workbook to Xlsx workbook.save("27-RadarChart.xlsx", SaveFileFormat.Xlsx); | |