An Area Chart can be used to represent the change in one or more data quantities over time. It is similar to a line graph. In area charts, the data points are plotted and connected by line segments. This helps in showing the magnitude of the value at different times. Unlike in line charts, the area between the line and x-axis is filled with color or shading in area charts.
DsExcel supports the following types of area charts.
| Chart Type | Chart Snapshot | Use Case |
|---|---|---|
| Area |
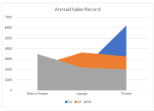
Area chart |
Area chart is used to depict the data series as colored regions that help in comparing the values of multiple series for the same data point. This chart shows trends over time. |
| Aread3D |
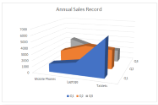
Area3D chart |
Area3D chart is used to represent the chart demonstration in 3D, which is a modification of 2D Area chart. It does not have a third dimension, it only looks volumetric in appearance. |
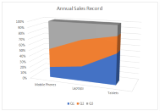
| AreaStacked |
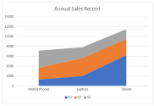
AreaStacked chart |
AreaStacked chart is used to depict data series as stacked regions with different colors that help in performing comparisons between multiple series for the same data point. This chart shows the trend of the contribution of each value over time or other categorical data. |
| AreaStacked100 |
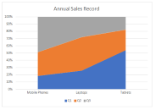
AreaStacked100 chart |
AreaStacked100 chart is used to depict the series of data points with positive and negative values shown over time to reveal values of multiple series for the same data point. This chart shows the percentage that each value contributes over time or other categorical data. |
| AreaStacked1003D |
AreaStacked1003D chart |
AreaStacked1003D is used to represent the AreaStacked100 chart in 3D, which looks volumetric in appearance. |
| AreaStacked3D |
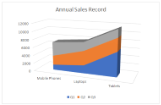
AreaStacked3D chart |
AreaStacked3D chart is used to represent AreaStacked chart in 3D, which is a modification of the 2D Area chart. |
Refer to the following example code to add Area Stacked Chart:
| C# |
Copy Code |
|---|---|
public void AreaCharts() { // Initialize workbook Workbook workbook = new Workbook(); // Fetch default worksheet IWorksheet worksheet = workbook.Worksheets[0]; // Prepare data for chart worksheet.Range["A1:D4"].Value = new object[,] { {null, "Q1", "Q2", "Q3"}, {"Mobile Phones", 1330, 2345, 3493}, {"Laptops", 2032, 3632, 2197}, {"Tablets", 6233, 3270, 2030} }; worksheet.Range["A:D"].Columns.AutoFit(); // Add Area Chart IShape areaChartShape = worksheet.Shapes.AddChart(ChartType.AreaStacked, 250, 20, 360, 230); // Adding series to SeriesCollection areaChartShape.Chart.SeriesCollection.Add(worksheet.Range["A1:D4"], RowCol.Columns, true, true); // Configure Chart Title areaChartShape.Chart.ChartTitle.TextFrame.TextRange.Paragraphs.Add("Annual Sales Record"); // Saving workbook to Xlsx workbook.Save(@"18-AreaChart.xlsx", SaveFileFormat.Xlsx); } | |