Stock chart is used to illustrate fluctuations in data over a time. It can represent fluctuations in stock, rainfall, or annual temperatures. The data arranged in columns or rows of a worksheet can be plotted in a Stock chart.
DsExcel supports the following types of Stock charts.
| Chart Type | Chart Snapshot | Use Case |
|---|---|---|
| StockHLC |
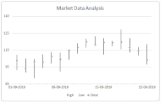
StockHLC chart |
A high-low-close chart displays the data values organized in the order: high, low, close with the close value lying in between the high and low values. |
| StockOHLC |
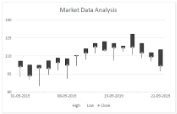
StockOHLC chart |
An open-high-low-close chart displays the data values organized in the order: open, high, low and close. |
| StockVHLC |
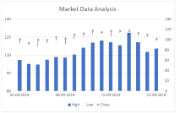
StockVHLC chart |
A volume-high-low-close chart displays the data values organized in the order: volume, high, low and close. |
| StockVOHLC |
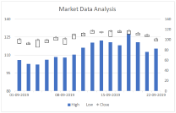
StockVOHLC chart |
A volume-open-high-low-close chart displays the data values organized in the order : volume, open, high, low and close. |
Refer the following code to add StockVOHLC chart:
| C# |
Copy Code |
|---|---|
public void StockCharts() { // Initialize workbook Workbook workbook = new Workbook(); // Fetch default worksheet IWorksheet worksheet = workbook.Worksheets[0]; // Prepare data for chart worksheet.Range["A1:D17"].Value = new object[,] { { null, "High", "Low", "Close" }, { new DateTime(2019, 9, 1), 105.76, 92.38, 100.94 }, { new DateTime(2019, 9, 2), 102.45, 90.14, 93.45 }, { new DateTime(2019, 9, 3),102.11, 85.01, 99.89 }, { new DateTime(2019, 9, 4), 106.01, 94.04, 99.45 }, { new DateTime(2019, 9, 5),108.23, 98.16, 104.33 }, { new DateTime(2019, 9, 8),107.7, 91.02, 102.17 }, { new DateTime(2019, 9, 9),110.36, 101.62, 110.07 }, { new DateTime(2019, 9, 10),115.97, 106.89, 112.39 }, { new DateTime(2019, 9, 11),120.32, 112.15, 117.52 }, { new DateTime(2019, 9, 12),122.03, 114.67, 114.75 }, { new DateTime(2019, 9, 15),120.46, 106.21, 116.85 }, { new DateTime(2019, 9, 16),118.08, 113.55, 116.69 }, { new DateTime(2019, 9, 17),128.23, 110.91, 117.25 }, { new DateTime(2019, 9, 18),120.55, 108.09, 112.52 }, { new DateTime(2019, 9, 19),112.58, 105.42, 109.12 }, { new DateTime(2019, 9, 22),115.23, 97.25, 101.56 }, }; worksheet.Range["A:D"].Columns.AutoFit(); // Add Stock Chart IShape stockChartshape = worksheet.Shapes.AddChart(ChartType.StockVOHLC, 350, 20, 360, 230); // Adding series to SeriesCollection stockChartshape.Chart.SeriesCollection.Add(worksheet.Range["A1:D17"], RowCol.Columns); // Configure Chart Title stockChartshape.Chart.ChartTitle.Text = "Market Data Analysis"; // Configure value axis IAxis valueAxis = stockChartshape.Chart.Axes.Item(AxisType.Value); valueAxis.MinimumScale = 80; valueAxis.MaximumScale = 140; valueAxis.MajorUnit = 15; // Configure category axis IAxis categoryAxis = stockChartshape.Chart.Axes.Item(AxisType.Category); categoryAxis.CategoryType = CategoryType.CategoryScale; categoryAxis.MajorTickMark = TickMark.Outside; categoryAxis.TickLabelSpacingIsAuto = false; categoryAxis.TickLabelSpacing = 5; // Configure Close Series Style ISeries series_close = stockChartshape.Chart.SeriesCollection[2]; series_close.MarkerStyle = MarkerStyle.Diamond; series_close.Has3DEffect = true; // Saving workbook to Xlsx workbook.Save("23-StockChart.xlsx", SaveFileFormat.Xlsx); } | |