Plotting Hierarchical and Flat Data in a .NET Sunburst Chart
Continuing with our Getting Started with .NET Sunburst Charts... series, let's dig deeper and understand more about the data that you can visualize with Sunburst chart.
Download Flat-Data Most Populated Countries Sample
In this blog, we'll cover:
- Understanding the Data model for Sunburst chart;
- Displaying hierarchical data;
- Displaying flat data
Understanding the Data Model for .NET Sunburst chart
Why do we need to talk about data models? We never did this earlier, with other charts; so why now? Sunburst charts are different from our earlier charts: a sunburst chart represents direct relationships at each level. To be precise, they represent multi-level parent-child relationships between the data items. For example, normally the sales in a year is divided into quarters, and quarters are further sub-divided into months. Each year, quarter and month represents an individual data item on a sunburst chart. The data model plays a pivotal role when working with a sunburst chart. The structure of data model helps determine which attributes of a sunburst needs to be configured and with what values to set up the chart. In turn, these attributes decide how the sunburst processes the data source to create the visual hierarchy. Based on the structure, we can broadly divide the data models in two categories: hierarchical and flat.
Displaying Hierarchical Data
Hierarchical data are most common when you're working with self-referencing tables or multiple tables in a relational data source. When mapped in code, these data tables are represented by a business object that contains a collection of same- or differently-typed business objects, termed as homogeneous or heterogenous data. Sunburst chart lets us identify and visualize data hierarchy whether homogenous or heterogeneous with much ease, with its robust data binding mechanism. Homogeneous Hierarchical data In this form of data, the chart’s data source is a list of items whose sub-items have the same data type::
public class DataItem
{
public string Year { get; set; }
public string Quarter { get; set; }
public string Month { get; set; }
public double Value { get; set; }
public List<DataItem> SubItems{ get; set; }
}
sunburst.DataSource = new List<DataItem>();
When working with this form of data, you’ll need to set the ChildItemsPath property to a string, specifying the property name that contains an item's child items. The following shows the Sunburst attributes that needs to be set for homogenous hierarchical data:
sunburst.Binding = "Value";
sunburst.BindingName = "Year,Quarter,Month";
sunburst.ChildItemsPath = "SubItems";
Heterogeneous Hierarchical Data In this form of data, the chart’s data source is a list of items whose sub-items have different data types:
public class Month
{
public string MName{ get; set; }
public double Value{ get; set; }
}

public class Quarter
{
public string QName{ get; set; }
public List<Month> Months{ get; set; }
public double Value{ get; set; }
}

public class Year
{
public string YName{ get; set; }
public List<Quarter> Quarters{ get; set; }
public double Value{ get; set; }
}

sunburst.DataSource = new List<Year>();
When working with this form of data, the ChildItemsPath needs to be set to a comma-separated string, where the comma-separated values represent the properties' names that contain the child items at each level. The following shows the sunburst attributes that need to be set for heterogeneous hierarchical data:
sunburst.Binding = "Value";
sunburst.BindingName = "YName,QName,MName";
sunburst.ChildItemsPath = "Quarters,Months";
Here's how a sales chart looks in sunburst, using hierarchical data: 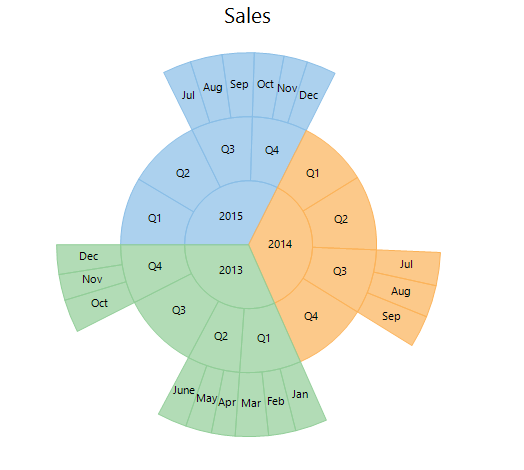 Visualizing Hierarchical data in Sunburst chart
Displaying Flat Data
With most common data sources available being relational in nature, it seems sunburst meets your needs for plotting data hierarchy. However, many applications use flat files (such as csv or tsv) because of their inherent advantages. Identifying the data hierarchy in these flat data structures is not as easy as it is with the relational data sources. But with Sunburst's flexible data binding mechanism, you can bind to flat data with the same ease to visualize the data hierarchy.
public class Country

{
public string Name { get; set; }
public string Region { get; set; }
public string SubRegion { get; set; }
public long Population { get; set; }
}

sunburst.DataSource = new List<Country>();
Setting the ChildItemsPath is not required in this case. All you need to do is to set the BindingName property, and the sunburst chart itself will divide your flat data structure into logical groups. The following shows the sunburst attributes for flat data:
sunburst.Binding = "Population";
sunburst.BindingName = "Region,SubRegion,Name";
Here's an example of the flat-data sunburst, displaying the world's 10 most populated countries:  Visualizing flat data in hierarchical view using Sunburst chart
Download Most Populated Countries Sample

MESCIUS inc.