Tracking Memory Allocation with DDMS and Android Studio
In the last article we covered how to get DDMS up and running and method profiling. Now we can continue inspecting our apps' performance by viewing the heap and tracking memory allocations in both DDMS (Dalvik Debug Monitor Server) and Android Studio.
Why view the heap?
The heap is a preserved amount of storage memory the Android OS gives your app. You need to minimize memory allocations to ensure Android does not crash your app due to OutOfMemory exceptions. The available heap space Android gives your app depends on the device's overall RAM and what's left over from other apps running on the device. Let's use the DDMS tool to get a real-time look at the heap your app uses. You can utilize this tool to do a walkthrough of your app's features and note places where the heap size tips the scale.
How to view the heap in DDMS
- Click on your app under the Devices tab
- Click on the "Update Heap" button
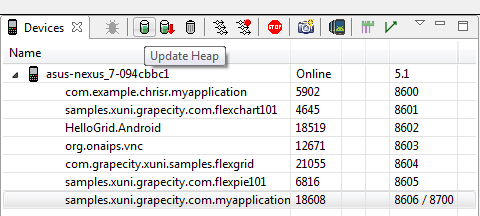
- Make sure you're viewing the "Heap" tab
- Click the "Cause GC" button on the "Heap" tab (GC = Garbage Collection)

 At this point you can see the overall Heap Size (what the Android OS has given your app to work with) as well as the total space allocated and free space.
  Additionally, you can view the different object types, number of those objects allocated, total size of all those objects, the smallest, largest, median, and average size.
  Clicking on an object type (i.e. data object) will render a bar chart where you can see the number of objects per size.
Why view the heap?
This tool gives you a real time look at the heap your app is using. This is where you need to minimize memory allocations to ensure Android does not crash your app due to OutOfMemory exceptions. Use the DDMS heap updates to do a walkthrough of your app's features and note places where the heap size tips the scale. The available heap space Android will give your app depends on the device's overall RAM and what's left over from other apps running on the device.
Need more heap space?
If you need more heap space (for instance your writing a game or photo editing app) you can request to utilize more by using Android:largeHeap="true" in your AndroidManifest.xml. This is not a "quickfix" if you're getting OutOfMemory exceptions, only utilize this attribute when your allocating memory and keeping an object reference to avoid garbage collection. https://developer.Android.com/training/articles/memory.html
Memory Allocation Tracker (DDMS)
The View Heap feature was helpful at viewing the overall picture, but I need to see what / where memory is being allocated more specifically. By using the Allocation Tracker I can get a full list of all memory allocations between two points in time.
- Click on your app under Devices
- Make sure you're viewing the "Allocation Tracker" tab
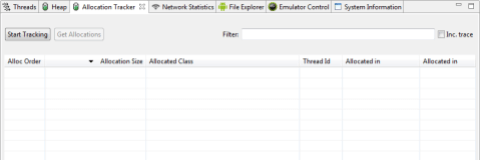
- Click Start Tracking
- Perform some actions on your test app
- Click Get Allocations
- Click Stop Tracking
Note that it might take a few extra seconds to retrieve the data depending on the number of objects being allocated between the start and stop. The things you want to look for are #1 large sizes under the Allocation Size column, and #2 a large amount of the same instances being allocated. By clicking on a row in the table it will display the stacktrace of where that object was allocated. 
Android Studio Allocation Tracker
The DDMS Allocation Tracker is helpful, but it does not really let us quickly identify exact parts of code that are excessively allocating memory. Android Studio memory allocation tracking has data visualization tools to help me identify the worst culprits that are allocating the most memory. First we need to collect a data set to view.
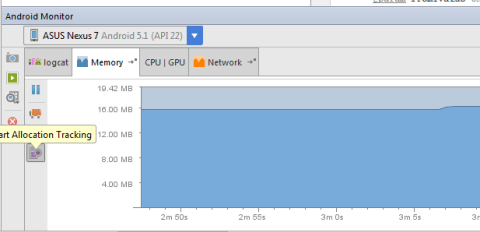
- Open the Android Monitor at the bottom of Android Studio
- Open the "Memory" tab
- Click "Start Memory Tracking"
- Perform actions on app to record
- Stop Memory Tracking
- Click Pie Chart button
 By default the chart will be a Sunburst chart. The first inner ring is the parent of everything, as you move towards the outer rings you can see the method calls and how many object allocations they are responsible for, as well as the total amount of memory allocated. The outermost rings represent the actual objects being allocated. This chart gives me an easy way to visualize all the other methods a specific method calls and the amount of objects allocated. Additionally, the width of each bar represents size of allocation. Things you want to look for are large slices on the othermost ring or the second outermost ring (Second outermost ring will sum lots of small allocations to show a large slice). The largest slices will be in the bottom left hand corner; work counter-clockwise, viewing the stack trace of each ring, looking for your app's package name.
  A sunburst chart where pie slices represent allocation size You might be more of a bar-chart-type of person, and, well, Android Studio has you covered with the Layout chart. In the upper top left corner you can switch between Sunburst vs Layout, and additionally chart the object allocation count or object allocation size. Layout mode might be easier to read, since it renders from left to right and the last right bars represent the final objects allocated.
  A layout chart where each bar represents an allocation count
Conclusion
In this three-part series of posts I've covered the available tools for performance profiling Android apps. I covered measuring app performance in two key ways: time and memory. With method profiling we can identify methods that take the longest to identify bottlenecks in our app. With memory tracking we can see what parts of our app take the most memory and likely culprits to app crashes.
Join my webcast on Android Performance and Profiling tips >>

MESCIUS inc.