Visualizing Data Using WinForms Bullet Graphs
What is a Bullet Graph?
A bullet graph is a type of linear gauge that displays a single key measure (for example, current year-to-date revenue) on a linear scale along with comparative measure (for example, target revenue) and different qualitative ranges - to instantly signal whether the measure is good, bad, or in some other state.
Bullet graphs were introduced by the dashboard design expert Stephen Few to overcome the limitations of dashboard gauges and meters which convey too little information, lack context, and occupy a lot of space on the dashboards. Bullet graphs on the other hand, are power packed with information and occupy little space in the grids and dashboards.
Bullet Graph Components
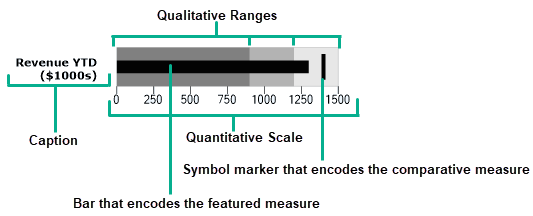 For example, by looking at the bullet graph shown in the above image we can easily compare the actual revenue with the target revenue and also know the range in which the revenue lies, i.e. bad, good, or best.
Text Label/Caption: This portion of the bullet graph describes the key measure which is being displayed by the bullet graph.
Quantitative Scale: This portion of the bullet graph functions like a linear axis which is used to measure the value of the metrics. It consists of tick marks and text labels that identify equal intervals of the measure.
Featured Measure: This element of the bullet graph displays the primary data (for example, current year-to-date revenue, customer satisfaction, etc.) and is presented by a bar in the bullet graph.
Comparative Measure: Comparative measure refers to a metric against which you want to compare your featured measure (e.g., target revenue). It is encoded as a short line that runs perpendicular to the orientation of the graph.
Qualitative Ranges: The qualitative ranges are used to separate the quantitative scale into different zones or performance ranges to instantly signal whether the featured measure is in good, bad, or some other state. The qualitative ranges are encoded as rectangles of distinct intensities from dark to light of a single hue so that they are easily discernible by those who are color blind. Darker color intensities are used for the poor states and the lighter color intensities are used for the favorable states.
Introducing the BulletGraph Control in 2019v1 Release
Bullet graphs convey rich information in a compact space, making them ideal for usage in dashboards and grids. The WinForms Edition 2019v1 release introduces a new control called BulletGraph which can be easily integrated in your dashboards and grids to display single-valued metrics.
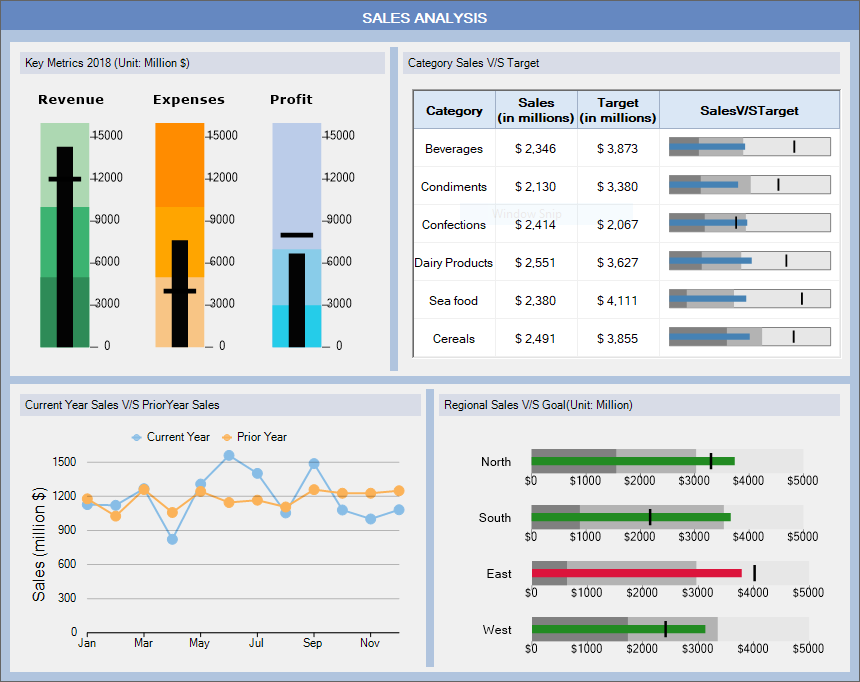
Consider a scenario where you want to use the BulletGraph control in a Sales dashboard to:
- Analyze the different key metrics such as revenue, expenses and profit of a company.
- Depict the regional sales data.
- Visualize the sales value of different product categories in a data grid as shown in the above image.
Let's see how different properties of the BulletGraph control can be used to create the above dashboard.
Setting the Featured Measure and Comparative Measure Values
To use the BulletGraph control in your dashboards, simply drag and drop the BulletGraph control on your dashboard (DashboardLayout control) or Form, and then specify the values of the featured measure and comparative measure using the Value and Target properties of the C1BulletGraph class as shown.
//Sets the values of the featured measure and comparative measure for the BulletGraph
bulletGraph.Value = keyMetrics[i].Value;
bulletGraph.Target = keyMetrics[i].TargetValue;
Customizing the Quantitative Scale
You can customize the quantitative scale of the bullet graph, such as the range of the scale using the Minimum and Maximum properties of the C1BulletGraph class. Other settings including the scale labels interval, tick marks interval, and scale labels formatting can be changed using the GraphScale property of the C1BulletGraph class. The scale of the BulletGraph can also be shown in reversed order using the IsReversed property of the C1BulletGraph class as shown.
//Customizes the quantitative scale
bulletGraph.Minimum = 0;
bulletGraph.Maximum = 16000;
bulletGraph.GraphScale.LabelsInterval = 3000;
bulletGraph.GraphScale.MarksInterval = 3000;
bulletGraph.IsReversed = true;
Changing the BulletGraph Orientation
By default, the BulletGraph control is oriented in the horizontal direction however you can orient it in either vertical or horizontal direction depending on your needs using the Orientation property of the C1BulletGraph class. The code below shows how the bullet graphs depicting the key metrics can be oriented vertically on the dashboard.
//Orients the BulletGraph vertically
bulletGraph.Orientation = C1GaugeOrientation.Vertical;
Defining the Qualitative Ranges
The BulletGraph control allows you to define up to three qualitative ranges. You can use the Good and Bad properties of the C1BulletGraph class to define the ranges that are considered good and bad for the featured measure. The remaining range is considered best/most favorable for the featured measure and is encoded by a rectangle of lightest color intensity.
//Defines the qualitative ranges for the BulletGraph
bulletGraph.Good.To = keyMetrics[i].GoodValue;
bulletGraph.Bad.To = keyMetrics[i].BadValue;
Customizing the BulletGraph Caption
You can add and customize the caption of your bullet graph using the Caption property of the C1BulletGraph class. The code below depicts an example.
//Customizes the BulletGraph Caption
bulletGraph.Caption.Text = keyMetrics[i].MetricName;
bulletGraph.Caption.Alignment = StringAlignment.Near;
Styling the BulletGraph
The default appearance of the BulletGraph control and the different visual elements it is composed of such as labels, marks and ranges, can be customized using the BulletGraphTheme class.
BulletGraph in Data Grids
You can render the BulletGraph control as an image in data grids such as FlexGrid, MS DataGridView, etc. by making use of the GetImage method of the C1BulletGraph class.
And it's complete! Click here to download the sample.
So, go on and use the BulletGraph control in your dashboards and data grids!

Palak Bansal