Posted 15 January 2019, 7:36 pm EST - Updated 3 October 2022, 1:58 am EST
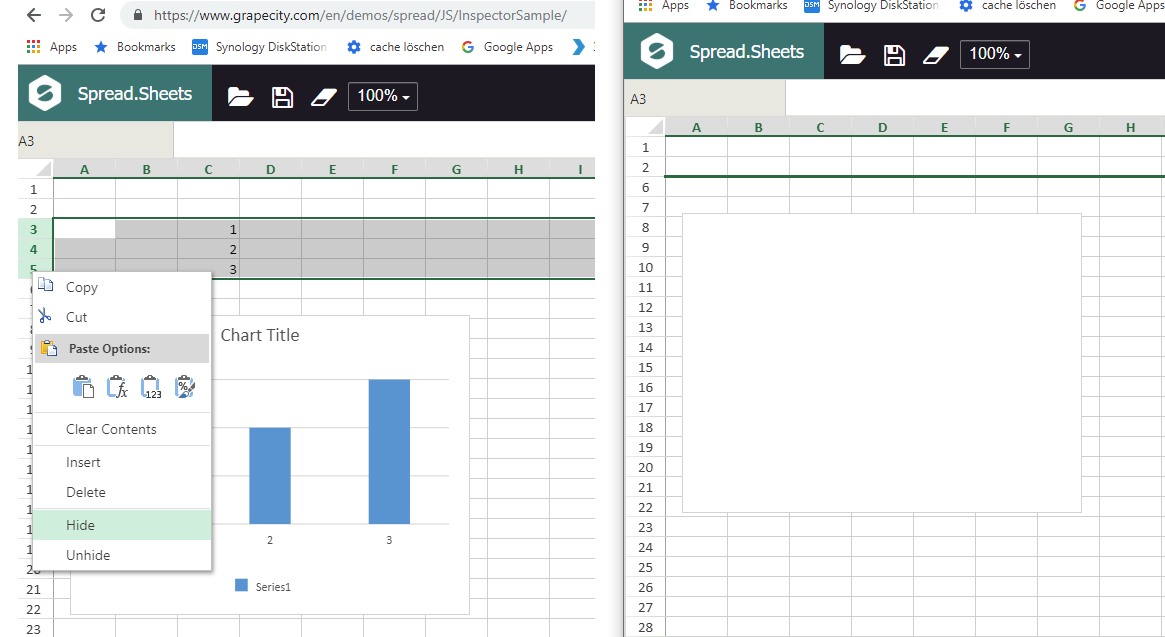
Chart with values from hidden rows empty
Posted by: martin.mayr on 15 January 2019, 7:36 pm EST
-

martin.mayr
-

abhishek.dutta

Posted 16 January 2019, 10:09 pm EST
Hi,
It’s currently not possible to modify this behavior,however we are in discussion with the Dev Team for a possible solution. We will update you it soon.
-
abhishek.dutta
Posted 20 January 2019, 10:01 pm EST
Hi,
We have checked this behavior and found that this behavior is similar to MS Excel. however we would like to know more about your use case.
So, if the row is hidden, should the chart not hide it?
or
If all chart data range is not visible , the should chart also not be visible? -
martin.mayr
Posted 6 February 2019, 4:32 am EST
we want to show the chart but not the rows with the data.
So we hid the rows and hoped that the chart would still be visible -

reeva.dhingra
Posted 6 February 2019, 4:03 pm EST
Hello Martin,
In that case you can set the RowHeight to 0 for rows you want to hide and set the ColumnWidth to 0 for columns you want to hide as shown in attached sample and code below:-
    ```
//Change the height of the second row.
        sheet.setRowHeight(1, 0, GC.Spread.Sheets.SheetArea.viewport);

        //Change the width of the third column.
        sheet.setColumnWidth(2, 0, GC.Spread.Sheets.SheetArea.viewport);
Hope it helps. Thanks, Reeva [zip filename="SpreadJS_Chart_V12_SeriesHideWidth.zip"]https://gccontent.blob.core.windows.net/forum-uploads/file-3bb6b780-96f2-4028-b229-d43778cd9a7e.zip[/zip]