Posted 27 July 2018, 3:57 am EST
Hi,
Thanks for notifying the issue.
We were able to replicate the issue at our end and hence it has been forwarded to concerned team.
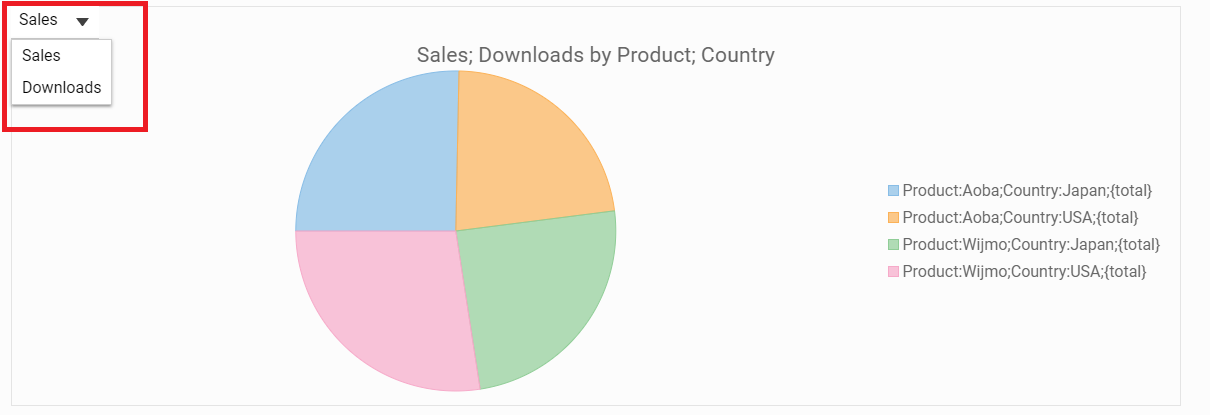
In the meantime, please call invalidate method once the chart is rendered:-
Refer to the following code snippet:-
var chart=new olap.PivotChart('#pivotChart',{
	itemsSource: panel,
	showLegend: 'Always',
	chartType: olap.PivotChartType.Pie
});
let labelsUpdated=false;
if(chart.flexPie){
	chart.flexPie.rendered.addHandler(()=>{
		if(!labelsUpdated){
			labelsUpdated=true;
			chart.invalidate();
		}
	});
}
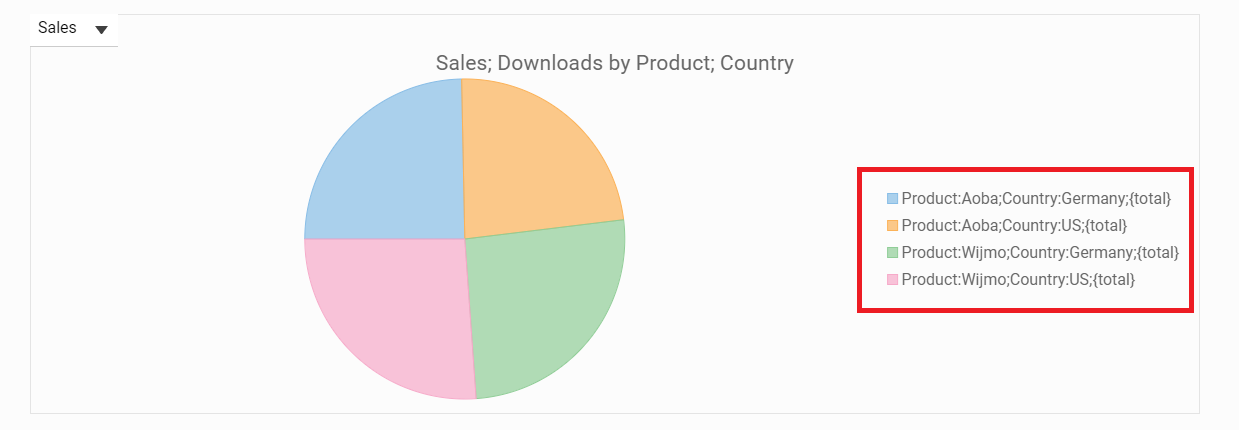
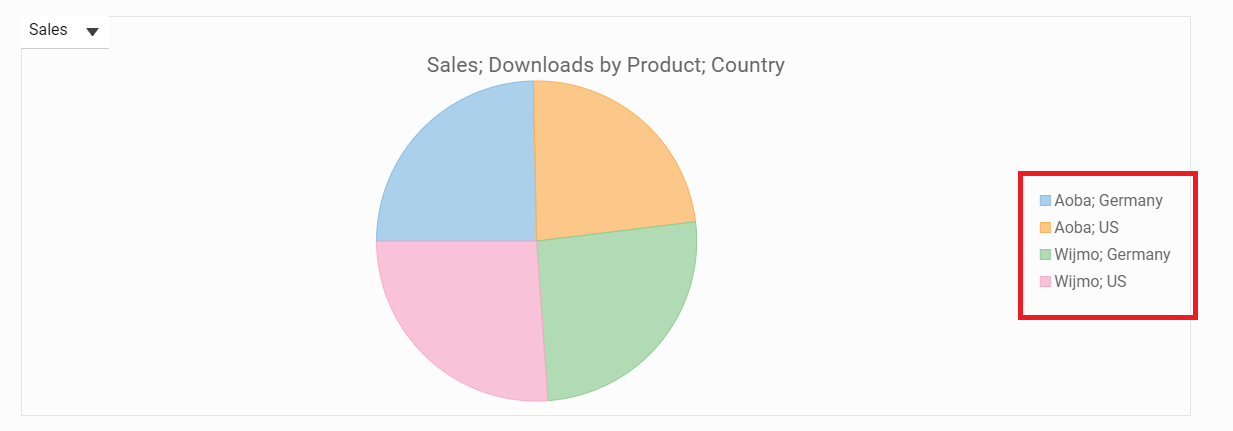
Is there is a way i can customize the pivot chart labels?
For changing the legend label in pivot chart you may set the header property of pivotFields of binded pivotEngine.
Please refer to the following code snippet:-
/* create pivot panel */
var panel=new olap.PivotPanel("#panel",{
	itemsSource:getSimpleDataSet(1000)
});
/* get pivotPanel'sengine or create a new one */
var engine=panel.engine;
/* get field for which to change label(must be a value field) */
var field=engine.getFields('Downloads');
field.header="my custom header";
/* push to value fields */
engine.valuefields.push(field);
It will successfully set the chart’s legend, but please note that custom legends are not supported in FlexPie yet.
~Manish