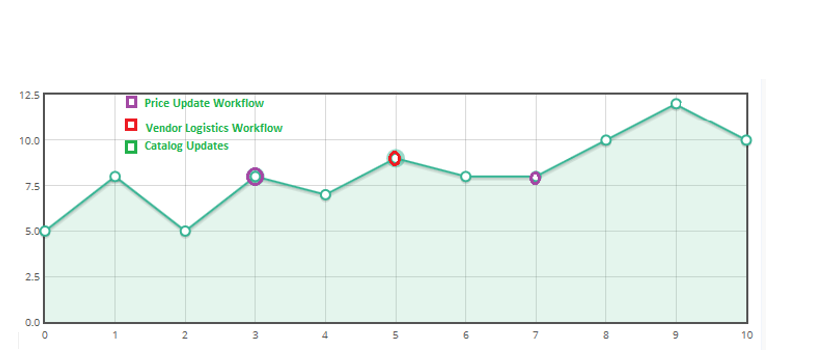
How to highlight or add stroke for data points of AreaChart in Angular 2 or 4?

Posted by: nilesh_nichal on 10 October 2018, 4:20 pm EST

  • Posted 10 October 2018, 4:20 pm EST - Updated 3 October 2022, 11:21 am EST

    Hi,

    We have a requirement to highlight or add a stroke to each data points of Area chart in Angular 2 or 4 in Wijmo library. As we can’t find any references in the API document to add the stroke or highlight the data points.

    Please find the attached image for reference and help us.

  • Posted 11 October 2018, 4:19 pm EST

    This thread seems to be duplicate.

    Please refer to the following thread:

    https://www.grapecity.com/en/forums/wijmo/how-to-highlight-or-add-st

    ~Sharad

Need extra support?

Upgrade your support plan and get personal unlimited phone support with our customer engagement team

Learn More

Forum Channels