Limit the Y-axis values in Bar chart

Posted by: ykumar23 on 10 May 2018, 12:08 am EST

    • Post Options:
    • Link

    Posted 10 May 2018, 12:08 am EST - Updated 3 October 2022, 11:30 am EST

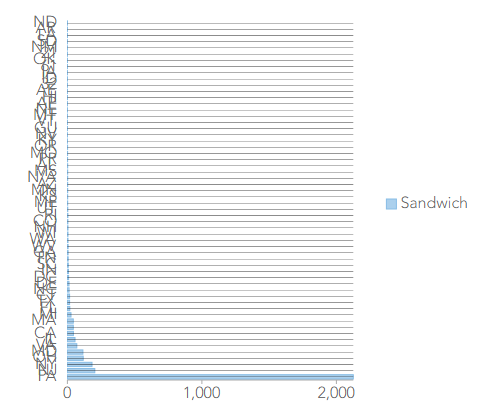
    I have a Bar chart that display a lot a y-axis values, the issue is that the y-axis labels are being overlapped. Wanted to know if there’s any way that we could restrict the number of values being displayed on the chart.

    Example : Display first 5 rows or values greater than a limit.

  • Posted 10 May 2018, 12:58 am EST

    Hi,

    You may limit the Axis by setting min and max property for Axis. After setting min and max property, the values will shown between min and max limit.

    You may also limit the gap between two values on Axis using majorUnit property.

    Please refer to the Customizing Axes for FlexChart Intro demo sample.

    http://demos.wijmo.com/5/angular2/flexchartintro/flexchartintro/

    ~Manish

Need extra support?

Upgrade your support plan and get personal unlimited phone support with our customer engagement team

Learn More

Forum Channels