Multiple labels in flex chart component for trend visualization

Posted by: ramiro.olivencia on 14 February 2019, 2:50 am EST

    • Post Options:
    • Link

    Posted 14 February 2019, 2:50 am EST - Updated 3 October 2022, 11:12 am EST

    Hi! I’m using line charts through the wjFlexChart component. I was asked to implement a feature to draw labels for all of the line charts when the user hovers horizontally through the lines.

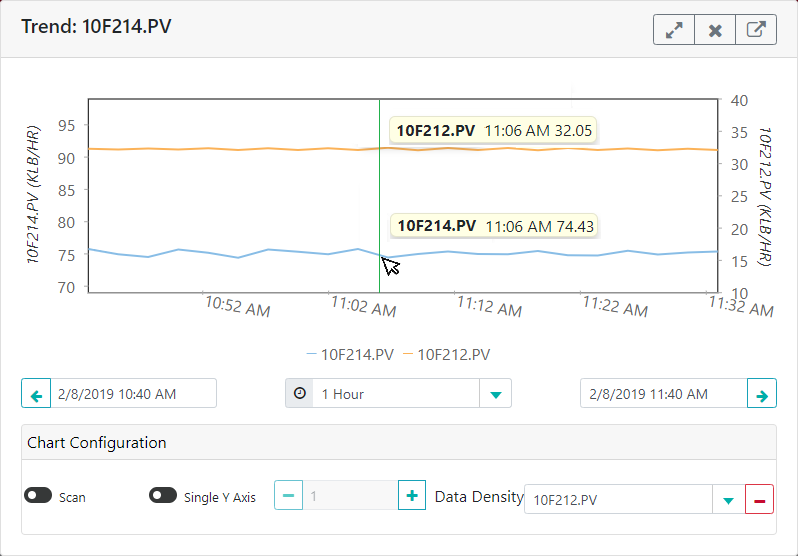
    I want to know if something like that is achievable by using the Wijmo flex chart. Here’s a static mockup of what I want to achieve by showing several labels in the flex chart:

  • Posted 15 February 2019, 12:13 am EST

    Hi,

    We can achieve the required functionality by handling the mousemove event.

    In mousemove event, we need to use hitTest() method to get details about the point curser is over. And if cursor is over a data point then we can set the tooltip for the all the series points.

    Please refer to the following sample which demonstrates the same:

    https://stackblitz.com/edit/angular-uh7r22?file=app%2Fapp.component.ts

    ~Sharad

Need extra support?

Upgrade your support plan and get personal unlimited phone support with our customer engagement team

Learn More

Forum Channels