Chart from data file

Posted by: office on 20 January 2019, 10:26 pm EST

    • Post Options:
    • Link

    Posted 20 January 2019, 10:26 pm EST - Updated 3 October 2022, 11:30 pm EST

    Hi

    I’m building a chart that will take a data set from a text file, and show a number of charts in a single view.

    Each chart will have a single data item displayed in it.

    Below is your stocks chart. The bit I’m interested in replicating is the bottom part of the chart, circled in red.

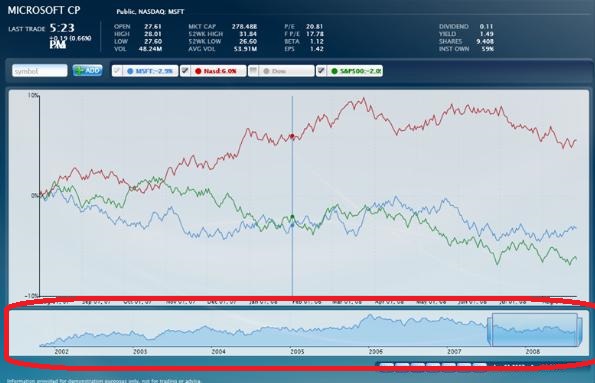
    What I’d like to be able to do is allow the user to add and remove as many of these charts as they’d like, and select the data item from a list that will be populated when the data set is loaded from a text file.

    When a chart is added or removed, the rest of the charts must resize to be equally sized vertically.

    The user must be able to zoom in and out on the chart, so that they can see detail of an area of the data, and then zoom back out to an overview.

    All the charts must zoom in and out together, as the data items are all recorded at the same time.

    Firstly, what is the chart type I would use to replicate that?

    Secondly, is there anything I’ve mentioned above that would not be possible to implement using these chart objects?

  • Posted 22 January 2019, 3:18 pm EST

    Hello,

    Your requirements can be fulfilled by any of C1Chart and FlexChart. However, we would suggest you to use FlexChart as It is our new and more efficient charting control.

    >>When a chart is added or removed, the rest of the charts must resize to be equally sized vertically

    FlexChart automatically update the Y-Axis when new series/data is added/loaded. Hence all the existing data series will be shifted accordingly.

    >>All the charts must zoom in and out together, as the data items are all recorded at the same time.

    With RangeSlider we update the main chart’s Axis bounds as per the Slider range. Hence all the data series will get zoomed-in/out together.

    Also, you can refer the ‘Currency Comparison’ sample, which is implementing all these requirements, from : https://www.grapecity.com/en/samples?platforms=wpf&display_limit=25&search_term=CurrencyComparison

    Thanks and Regards,

    Basant

  • Posted 29 January 2019, 12:08 am EST

    Thanks, that’ helps a lot.

    In Win Forms, we use C1Chart3D, and have just found out that this is implemented in a cube, so cannot be stretched in to an irregular shape.

    Does this limitation apply to the WPF version as well?

    See here:

    https://www.grapecity.com/en/forums/winforms-edition/c1chart3d-is-it-possible-t

  • Posted 29 January 2019, 5:35 pm EST

    Hello,

    Yes, Sorry to let you know but that is a limitation in WPF version as well.

    Regards,

    Basant

Need extra support?

Upgrade your support plan and get personal unlimited phone support with our customer engagement team

Learn More

Forum Channels