Posted 15 July 2019, 9:13 pm EST - Updated 3 October 2022, 1:20 am EST
Steps to reproduce behaviour:
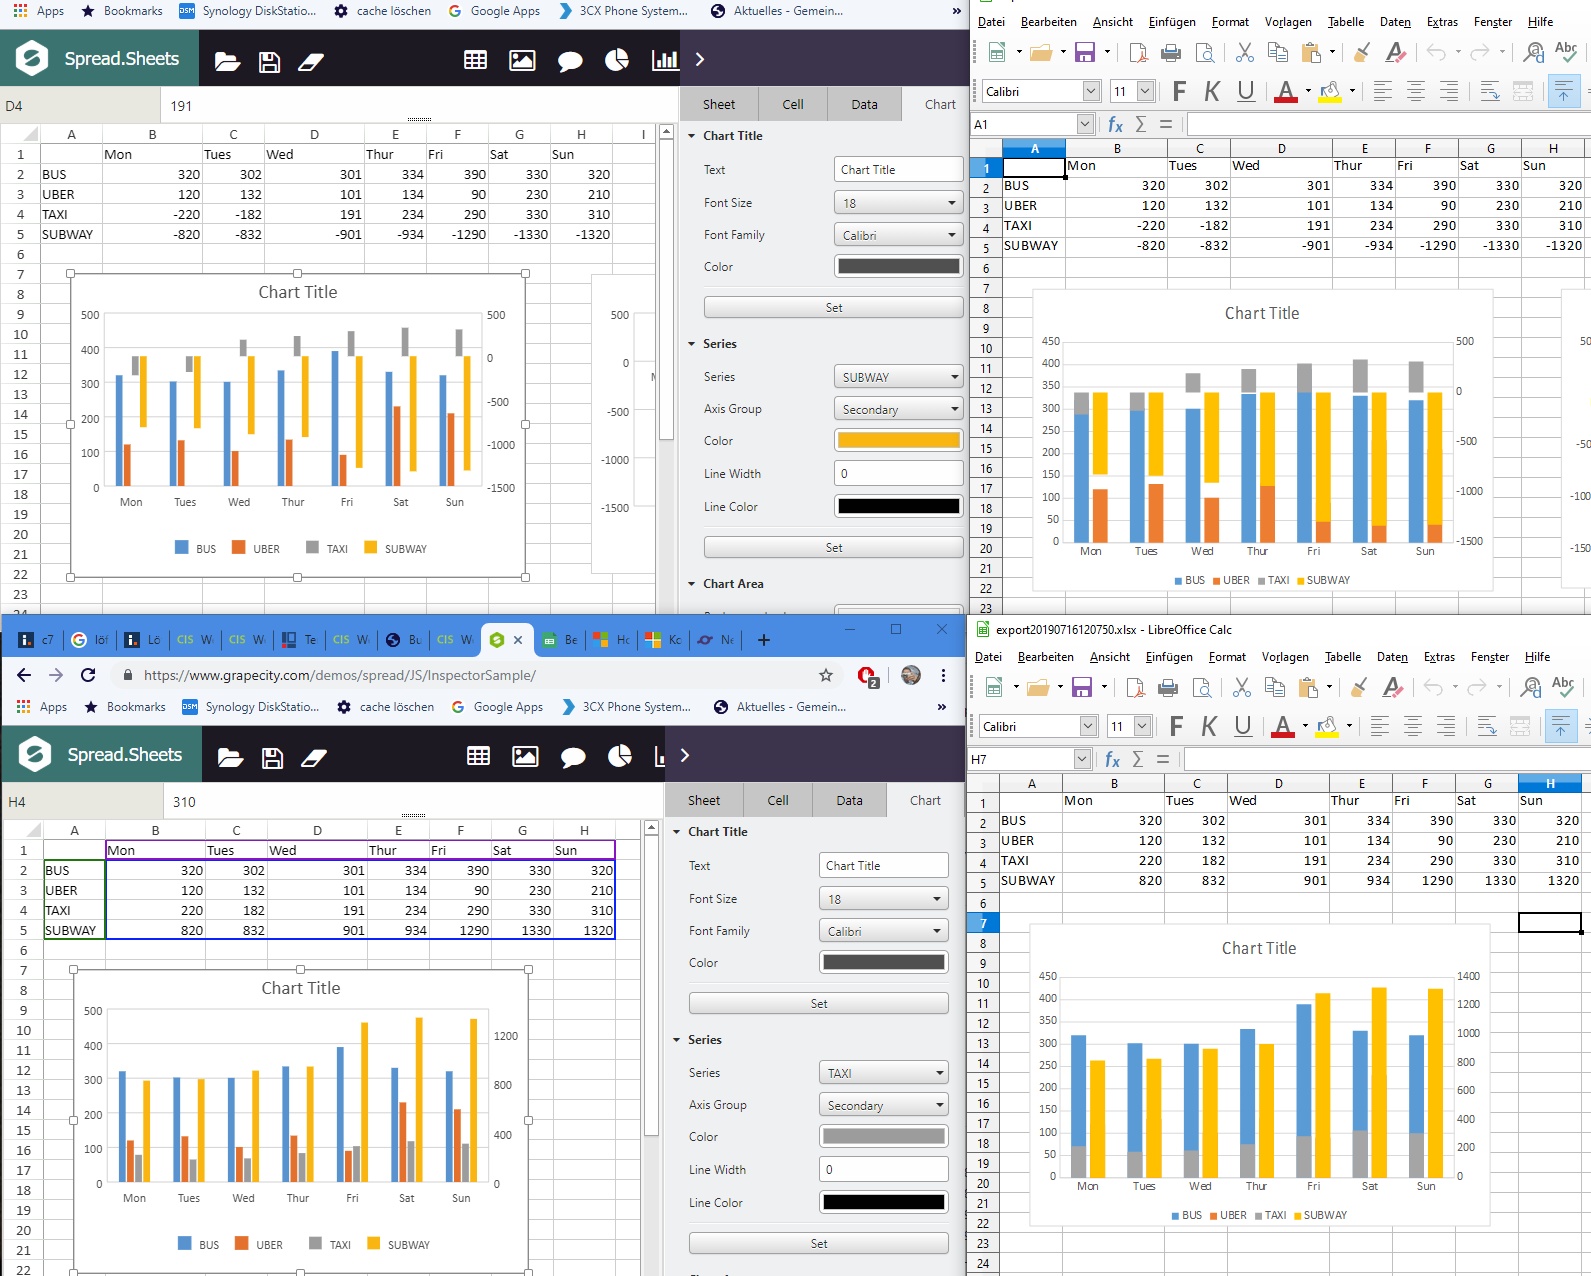
https://www.grapecity.com/demos/spread/JS/InspectorSample/
Chart.
Change TAXI and Subway to Axis Group Secondary.
Export to xlsx
->The bars of Axis Primary and Secondary are on top of each other.