Posted 22 November 2019, 5:52 pm EST
Hello,
In the SpreadJS web designer:
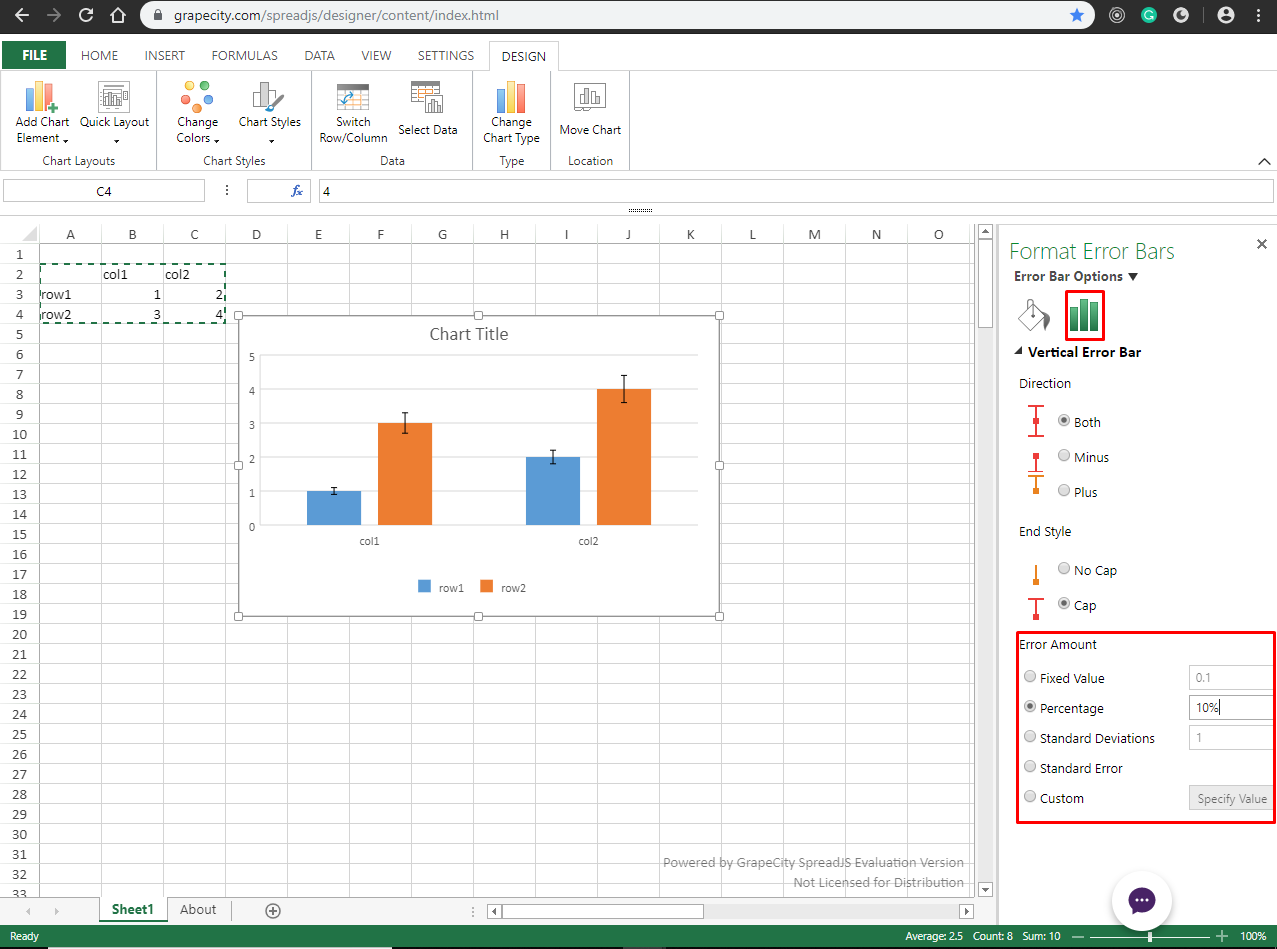
- Add chart elements → Error bars.
An opportunity must be given to the user to choose a column from the sheet for errors. You can not decide what the error boundaries might be from the y values. What you have is scientifically WRONG.
A typical example of just learning to program nothing else. If don’t understand it ask someone who does.
b) Add chart elements → Error bars → More Error bar options,
or
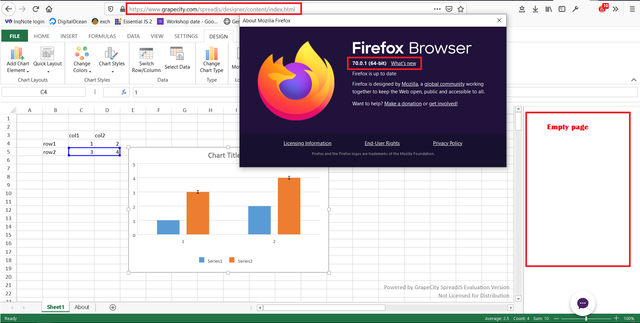
Add chart elements → … → More … options. What is it suppose to do? Load another bit of div section. Well it doesn’t. The RHS panel is blank.
Regards,