Posted 3 April 2023, 6:26 am EST - Updated 3 April 2023, 6:35 am EST
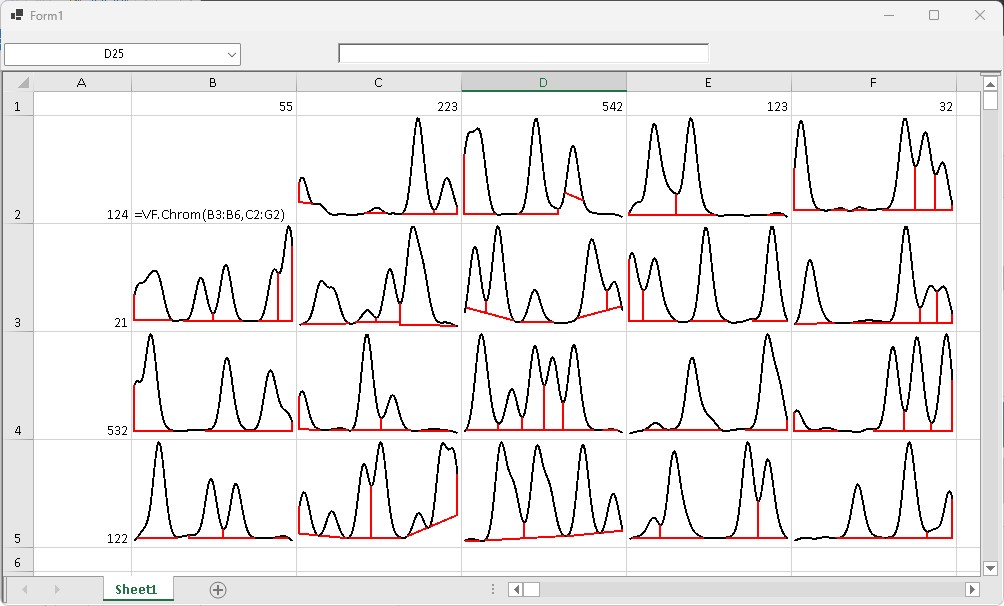
The screenshot shows the goal.
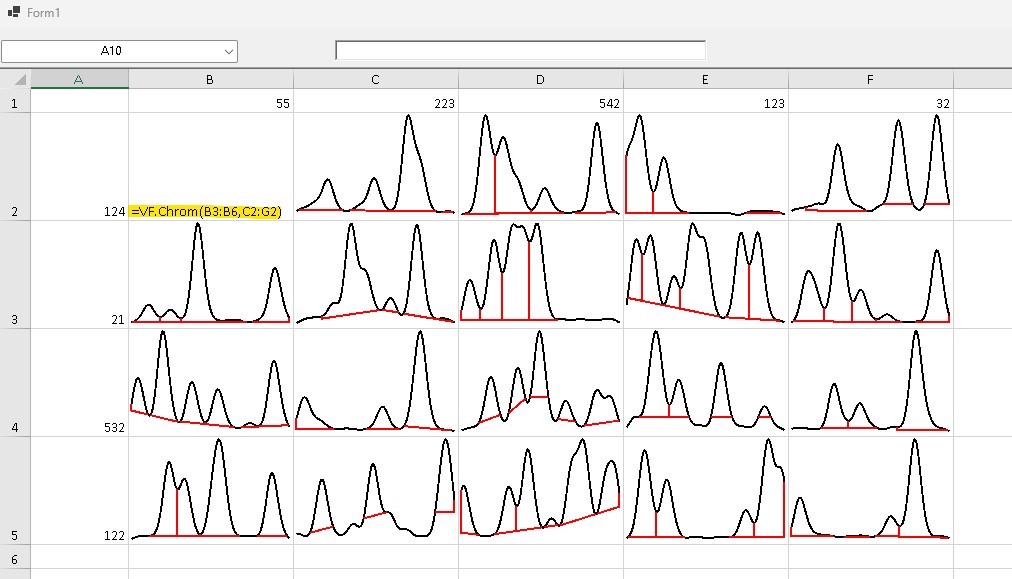
B2 contains a formula with a custom Visualizer function.
The function takes 2 parameters
The function will get data from an external source
I am unable to do 2 things.
-
It should show a graphical representation in cell B2 (like the other cells)
-
If the parameters are arrays, it should automatically display graphics in next cells…just like the spilling of a dynami array
Problem is that in the Paint method of the FunctionVisualizer, there is not access to the parametes like in the Evaluate method.
And in the Paint method, it is not possible to get the Rectangles of the next cells for spilling