How to customise Chart plot area

Posted by: n.serrette on 23 June 2022, 2:50 am EST

  • Posted 23 June 2022, 2:50 am EST - Updated 3 October 2022, 12:13 am EST

    Hi,

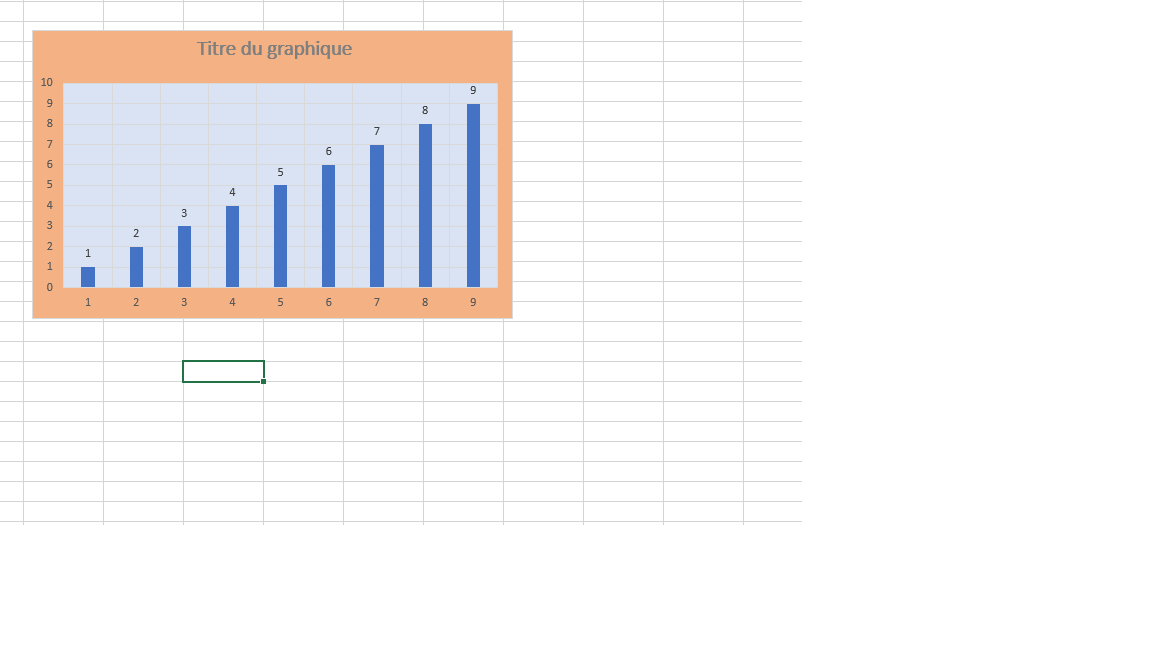
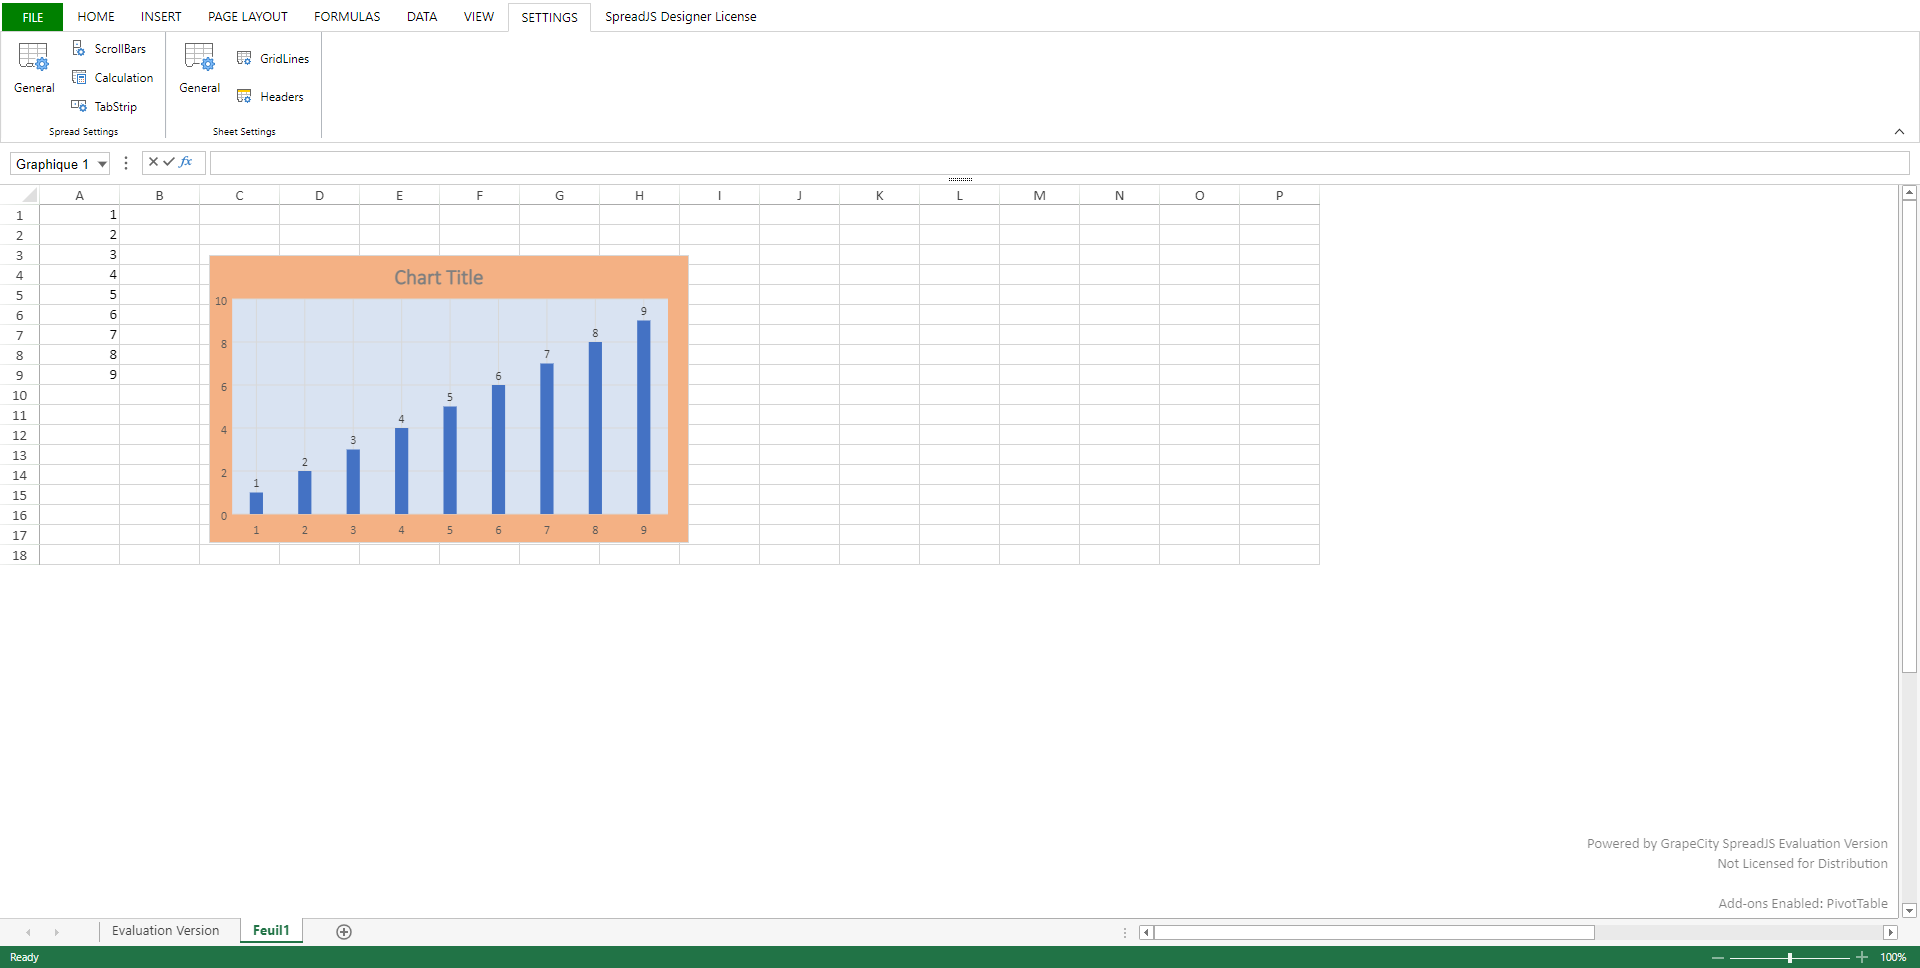
    I’m trying to set a customize a chart by setting a background color to the ChartArea and a different one for the Plot Area.

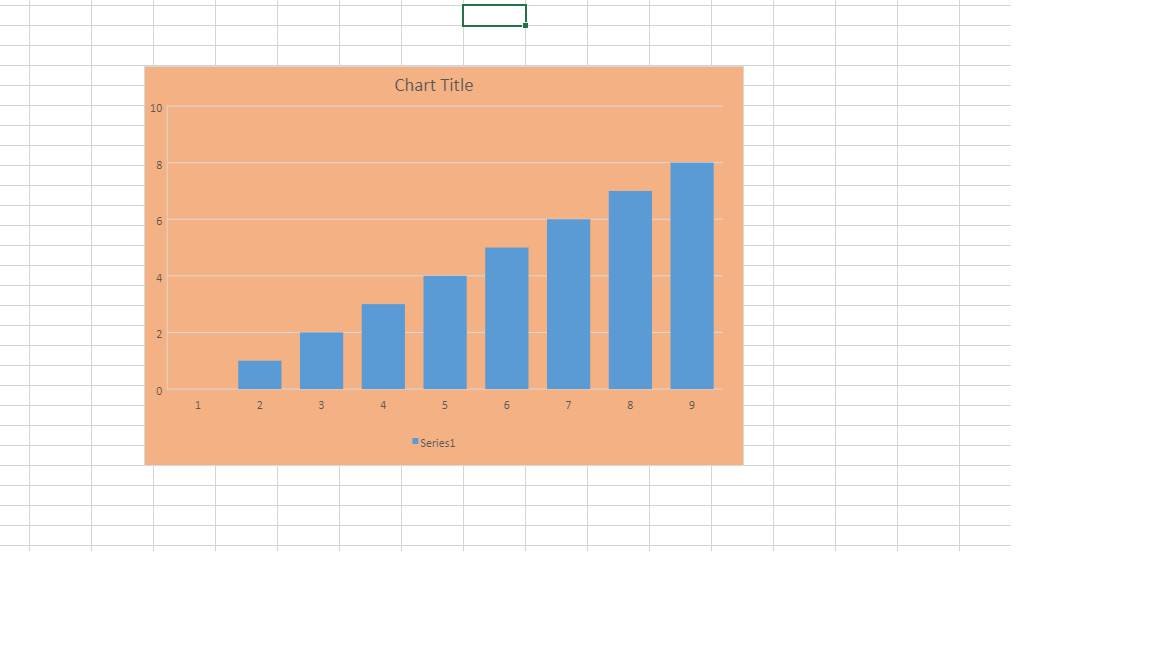
    I have no issue with the chart background color, but I can’t find the property to modify for the plot area.

    
    const chart = sheet.charts.add("chart", Gc.Spread.Sheets.Charts.ChartType.clusteredColumn, 300, 180, 600, 400, "A1:A9");
     chart.chartArea({ backColor: "rgb(244,177,132)" });


    It should be possible because importing a chart from excel which such settings work properly.

    Thanks,

  • Posted 23 June 2022, 2:57 am EST - Updated 3 October 2022, 12:13 am EST

    Here is the chart in excel :

    and in the spreadjs desingner after import:

    Thanks for your help,

  • Posted 26 June 2022, 12:25 pm EST

    Hi,

    Currently, there are no public APIs to support changing the fill of the plot area in a chart. The requested feature is already in discussion with the dev team. The internal id for this is: SJS-12411. We will let you know when we have an update regarding this.

    Regards

    Ankit

  • Posted 26 June 2022, 11:04 pm EST

    thanks for your answer, is their a place were I can follow the ticket?

  • Posted 27 June 2022, 3:22 pm EST

    Hi,

    The id mentioned in the comment is only for internal use only. Don’t worry, we will update you on this thread when we have an update for you.

    Regards

    Ankit

Need extra support?

Upgrade your support plan and get personal unlimited phone support with our customer engagement team

Learn More

Forum Channels