C1FlexReport with 3 charts 3 SQL tables

Posted by: saidnai on 3 March 2020, 2:35 am EST

    • Post Options:
    • Link

    Posted 3 March 2020, 2:35 am EST

    Dear All,

    I need to make a new C1FlexReport showing 3 Charts (2with Bars and 1 Pie). The data are coming from 3 different SQL-Server tables. Important i think is to pass the information to each chart to be shown per VB.NET.

    is there any easy code or sample Project to support me in this issue?

    Best regards

    Said

  • Posted 4 March 2020, 9:46 pm EST

    Hello,

    Please refer to the following documentation link:

    https://www.grapecity.com/componentone/docs/win/online-flexreport/BindingChartinMultipleDataSourceReport.html

    Thanks,

    Mohit

  • Posted 14 May 2020, 5:32 pm EST

    Dear Mohit,

    Thanks for the sample it helps a lot. I have adjusted it to my use and it works. Somehow i still need your help for the following:

    1) How can i show the value on each Bar in the Chart?
        2) How can i get each Bar having it's own Color?
    

    Here is the Code that i use:

            Dim chart = CreateChartField("Chart1", "TmpStatistikHG1")
            chart.Top = 0
            chart.Left = 200
            'chart.Header.Text = "Reklamation 1"
            chart.ChartArea2D.Inverted = False
            chart.ChartArea2D.AxisX.OnTop = True
            chart.ChartArea2D.AxisX.AnnoRotation = 50
            chart.ChartArea2D.AxisY.GridMajor.Visible = True
    
            chart.Legend.Visible = True
            chart.Legend.
    
            Dim group = chart.ChartGroups2D.Group0
            group.ChartType = C1.Win.FlexReport.Chart.Chart2DType.Bar   'Chart2DType.Bar
            Dim data = group.ChartData
            data.IsForEachRecord = True                                 ' show value of each record in data source
            data.CategoryGroups.AddNewGroup("=Bezeichung")              ' group by FullName
    
            Dim seriesTemplate = data.SeriesValues.AddNewSeries()
            seriesTemplate.DataValues.AddNewValue("=Anzahl")            ' show Age in AxisY
            seriesTemplate.LegendEntry = True
    

    Best regards

    Said

  • Posted 17 May 2020, 11:24 pm EST - Updated 3 October 2022, 2:54 pm EST

    Dear Mohit,

    I have joined the hole initial VB Code, As i told before. i have changed and added a Pie Chart. So the Question still the same :

    1) How can i show the value on each Bar in the Chart?

    2) How can i get each Bar having it’s own Color?

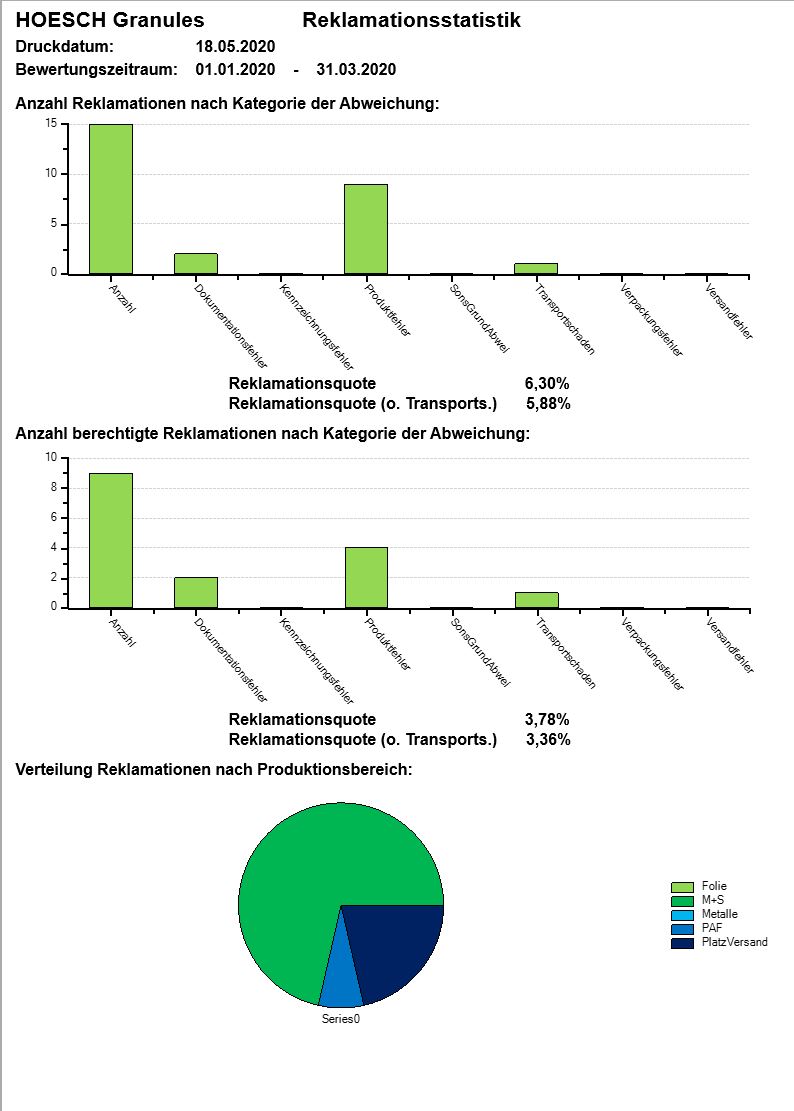
    I have also joined one figure as result.

    Private report As C1FlexReport

    Private Function CreateChartSampleReport() As C1FlexReport

    report = New C1FlexReport() With { _

    .ReportName = “ChartSample” _

    }

    ’ add data source “Employees”

    Dim dsEmployees = New DataSource() With { _

    .Name = “Employees”, _

    .ConnectionString = “Provider=Microsoft.Jet.OLEDB.4.0;Data Source=…..\Reports\C1Nwind.mdb;Persist Security Info=False”, _

    .DataSource = “Select * from Employees” _

    }

    report.DataSources.Add(dsEmployees)

    ’ add calculated field “FullName”.

    Dim calcFullName = New CalculatedField(“FullName”, GetType(String), “=LastName & “” “” & FirstName”)

    dsEmployees.CalculatedFields.Add(calcFullName)

    ’ add calculated field “Age”.

    Dim calcAge = New CalculatedField(“Age”, GetType(Integer), “=Year(Now())-Year(BirthDate) + 1”)

    dsEmployees.CalculatedFields.Add(calcAge)

    ’ add data source “Products”

    Dim dsProducts = New DataSource() With { _

    .Name = “Products”, _

    .ConnectionString = “Provider=Microsoft.Jet.OLEDB.4.0;Data Source=…..\Reports\C1Nwind.mdb;Persist Security Info=False”, _

    .RecordSource = “Select Products.CategoryID as CategoryID, Categories.CategoryName as CategoryName, Products.UnitsInStock as UnitsInStock from Products inner join Categories on Products.CategoryID = Categories.CategoryID” _

    }

    report.DataSources.Add(dsProducts)

    report.Sections.Header.Visible = True

    ’ add ChartField using Employees data source.

    Dim sectionEmployees = report.Sections.Header.SubSections.Add()

    sectionEmployees.Name = “ChartWithEmployees”

    sectionEmployees.Height = 5200

    sectionEmployees.Visible = True

    sectionEmployees.Fields.Add(CreateChartForEmployees())

    ’ add ChartField using Products data source.

    Dim sectionProducts = report.Sections.Header.SubSections.Add()

    sectionProducts.Name = “ChartWithProducts”

    sectionProducts.Height = 5200

    sectionProducts.Visible = True

    sectionProducts.Fields.Add(CreateChartForProducts())

    Return report

    End Function

    Private Function CreateChartForEmployees() As ChartField

    Dim chart = CreateChartField(“Chart1”, “Employees”)

    chart.Header.Text = “Employees Age”

    chart.ChartArea2D.Inverted = True

    chart.ChartArea2D.AxisX.OnTop = True

    Dim group = chart.ChartGroups2D.Group0

    group.ChartType = Chart2DType.Bar

    Dim data = group.ChartData

    data.IsForEachRecord = True ’ show value of each record in data source

    data.CategoryGroups.AddNewGroup(“=FullName”) ’ group by FullName

    Dim seriesTemplate = data.SeriesValues.AddNewSeries()

    seriesTemplate.DataValues.AddNewValue(“=Age”) ’ show Age in AxisY

    Return chart

    End Function

    Private Function CreateChartForProducts() As ChartField

    Dim chart = CreateChartField(“Chart2”, “Products”)

    chart.Header.Text = “Sum of UnitsInStock by Category”

    chart.ChartArea2D.Inverted = True

    chart.ChartArea2D.AxisX.OnTop = True

    Dim group = chart.ChartGroups2D.Group0

    group.ChartType = Chart2DType.Bar

    Dim data = group.ChartData

    Dim categoryGroup = data.CategoryGroups.AddNewGroup(“=CategoryID”)

    ’ group by each CategoryID

    categoryGroup.LabelExpression = “=CategoryName” ’ show the CategoryName in AxisX

    Dim seriesTemplate = data.SeriesValues.AddNewSeries()

    seriesTemplate.DataValues.AddNewValue(“=Sum(UnitsInStock)”)

    ’ show sum of UnitsInStock in AxisY

    Return chart

    End Function

    Private Function CreateChartField(name As String, datasource As String) As ChartField

    Dim chart = New ChartField() With { _

    .Name = name, _

    .Width = 7500, _

    .Height = 5000, _

    .Top = 100, _

    .Left = 100, _

    .DataSource = datasource _

    }

    chart.Border.Color = Color.Black

    chart.Border.Width = 15

    chart.Border.Style = DashStyle.Solid

    chart.Border.CornerRadius = New CornerRadius(200.0)

    chart.ChartArea2D.AxisY.AutoMin = False

    Return chart

    End Function

    Private Sub Button1_Click(sender As Object, e As EventArgs) Handles Button1.Click

    CreateChartSampleReport()

    C1FlexViewer1.DocumentSource = report

    End Sub

    Best regards

    Said

  • Posted 18 May 2020, 12:54 am EST

    Hi Said,

    1. You can use the ChartDataSeries.DataLabel for displaying labels on each bar:
     
    seriesTemplate.DataLabel.Visible = True
    seriesTemplate.DataLabel.Text = "{#YVAL}"
    

    For details on supported values in Text property, you may refer to https://www.grapecity.com/componentone/docs/win/online-flexreport/C1.Win.FlexReport.4.5.2~C1.Win.FlexReport.Chart.ChartDataLabel~Text.html

    1. For this, you may set the ChartData.ColorMode property as follows:
    data.ColorMode = ChartColorMode.ColorByCategory
    

    The above setting sets colors for each bar automatically. However, if you want to specify your own colors, then you can do the following:

    chart.ColorGeneration = ChartColorGeneration.CustomByPalette
    chart.Palette = "Red;Yellow;Green;" 
    

    Regards,

    Basant

  • Posted 18 May 2020, 5:53 pm EST

    Dear Basant,

    Thanks. It helps a lot. I will Need to look how to Change the Position and the font of the values.

    Best regards

    Said

  • Posted 18 May 2020, 8:19 pm EST

    Hi Said,

    Good to know that suggestions were helpful.

    Regarding Position of DataLabels, you may use the ChartDataLabel.Compass property as per you requirement. For styling/fonts, you may use the ChartDataLabel.Style.Font as required. For example:

    
    seriesTemplate.DataLabel.Compass = ChartLabelCompass.North 'i.e. On top of bar
    seriesTemplate.DataLabel.Style.Font.Bold = True
    

    Regards,

    Basant

  • Posted 18 May 2020, 8:51 pm EST

    Dear Basant,

    Touchdown :slight_smile:

    Best regards

    Said

Need extra support?

Upgrade your support plan and get personal unlimited phone support with our customer engagement team

Learn More

Forum Channels