Posted 28 September 2022, 11:21 pm EST - Updated 3 October 2022, 1:09 pm EST
Flexchart Diagramm
Posted by: saidnai on 28 September 2022, 11:21 pm EST
-

saidnai
-

nitin.sharma

Posted 29 September 2022, 10:30 pm EST
Hi,
Thanks for the snapshot.
To achieve your requirement, you need to add CategoryGroups and SeriesValue to the ChartData for both charts.
Please refer for the attached sample for the same : FlexReport_FlexChart_Representation.zip
Best Regards,
Nitin -
saidnai
Posted 29 September 2022, 11:31 pm EST - Updated 3 October 2022, 1:09 pm EST
-
nitin.sharma
Posted 2 October 2022, 9:49 pm EST
Hi,
Apologize for the delay in response.
We have created a VB application to add DataSeries and DataValue to the ChartField in report.(see code snippet)
Dim barChart = CType(report.Sections.Footer.Fields("Field1"), ChartField)
Dim group = New Chart.ChartDataGroup()
group.Name = "Name"
group.GroupExpression = "Name"

Dim series = New Chart.ChartDataSeries()
Dim dataValue = New ChartDataValue()
dataValue.ValueExpression = "Value"
series.DataValues.Add(dataValue)

            barChart.ChartGroups2D.Group0.ChartData.CategoryGroups.Add(group)
barChart.ChartGroups2D.Group0.ChartData.SeriesValues.Add(series)


Dim pieChart = CType(report.Sections.Footer.Fields("Field2"), ChartField)
Dim group2 = New Chart.ChartDataGroup()
group2.Name = "Name"
group2.GroupExpression = "Name"

Dim series2 = New Chart.ChartDataSeries()
Dim dataValue2 = New ChartDataValue()
dataValue2.ValueExpression = "Value"
series2.Label = "Series Data"
series2.DataValues.Add(dataValue2)

            pieChart.ChartGroups2D.Group0.ChartData.CategoryGroups.Add(group2)
pieChart.ChartGroups2D.Group0.ChartData.SeriesValues.Add(series2)
Please refer the attached sample for the same : FlexReport_Chart_VB.zip
Best regards,
Nitin -
saidnai
Posted 3 October 2022, 11:24 pm EST
Hi Nitin,
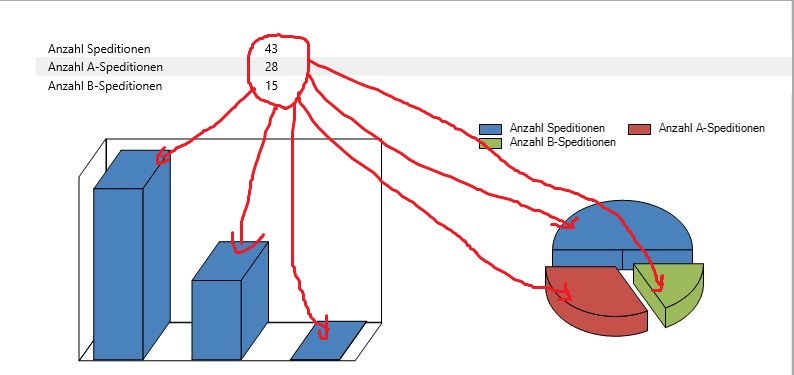
I think i was not clear with what i need. I will explain it carefully:
I am using a Flexchart in a Flexreport as you can see in the pictures. I need to show the values on the bars diagramm or the Pie diagramm. So how can i build it in the Flexreport properties?PS: (please see my pictures)
Best regards
Said -
nitin.sharma
Posted 5 October 2022, 7:37 pm EST
Hi,
Apologize for the misunderstanding.
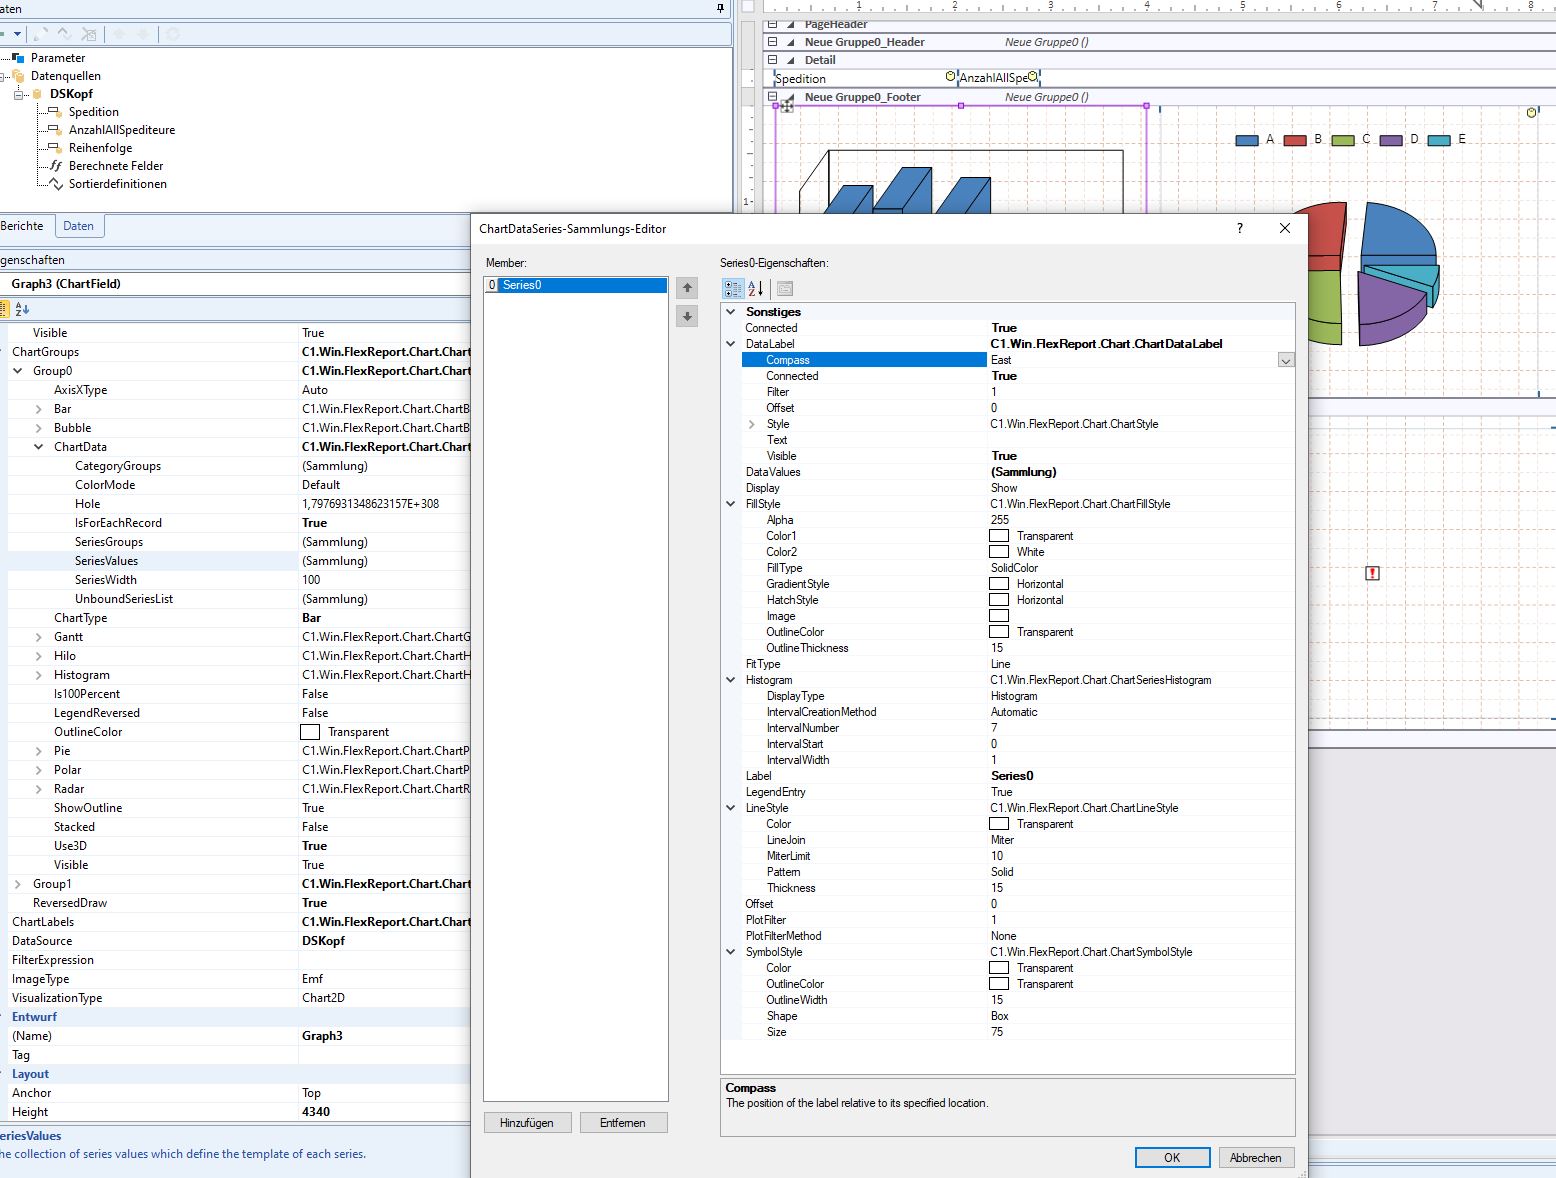
As we understand, you want to set DataLabel on Bar and Pie Chart.
To achieve this requirement you can set Text = {#YVAL} on DataLabel.This will shows the Bounded Y value on the particular symbol.
Please refer the attached sample for the same : FlexReport_FlexChart_Representation_Mod.zip
Best Regards,
Nitin