Flexchart visualization error

Posted by: alex.corti on 18 May 2023, 1:29 am EST

    • Post Options:
    • Link

    Posted 18 May 2023, 1:29 am EST - Updated 18 May 2023, 1:34 am EST

    Good afternoon,

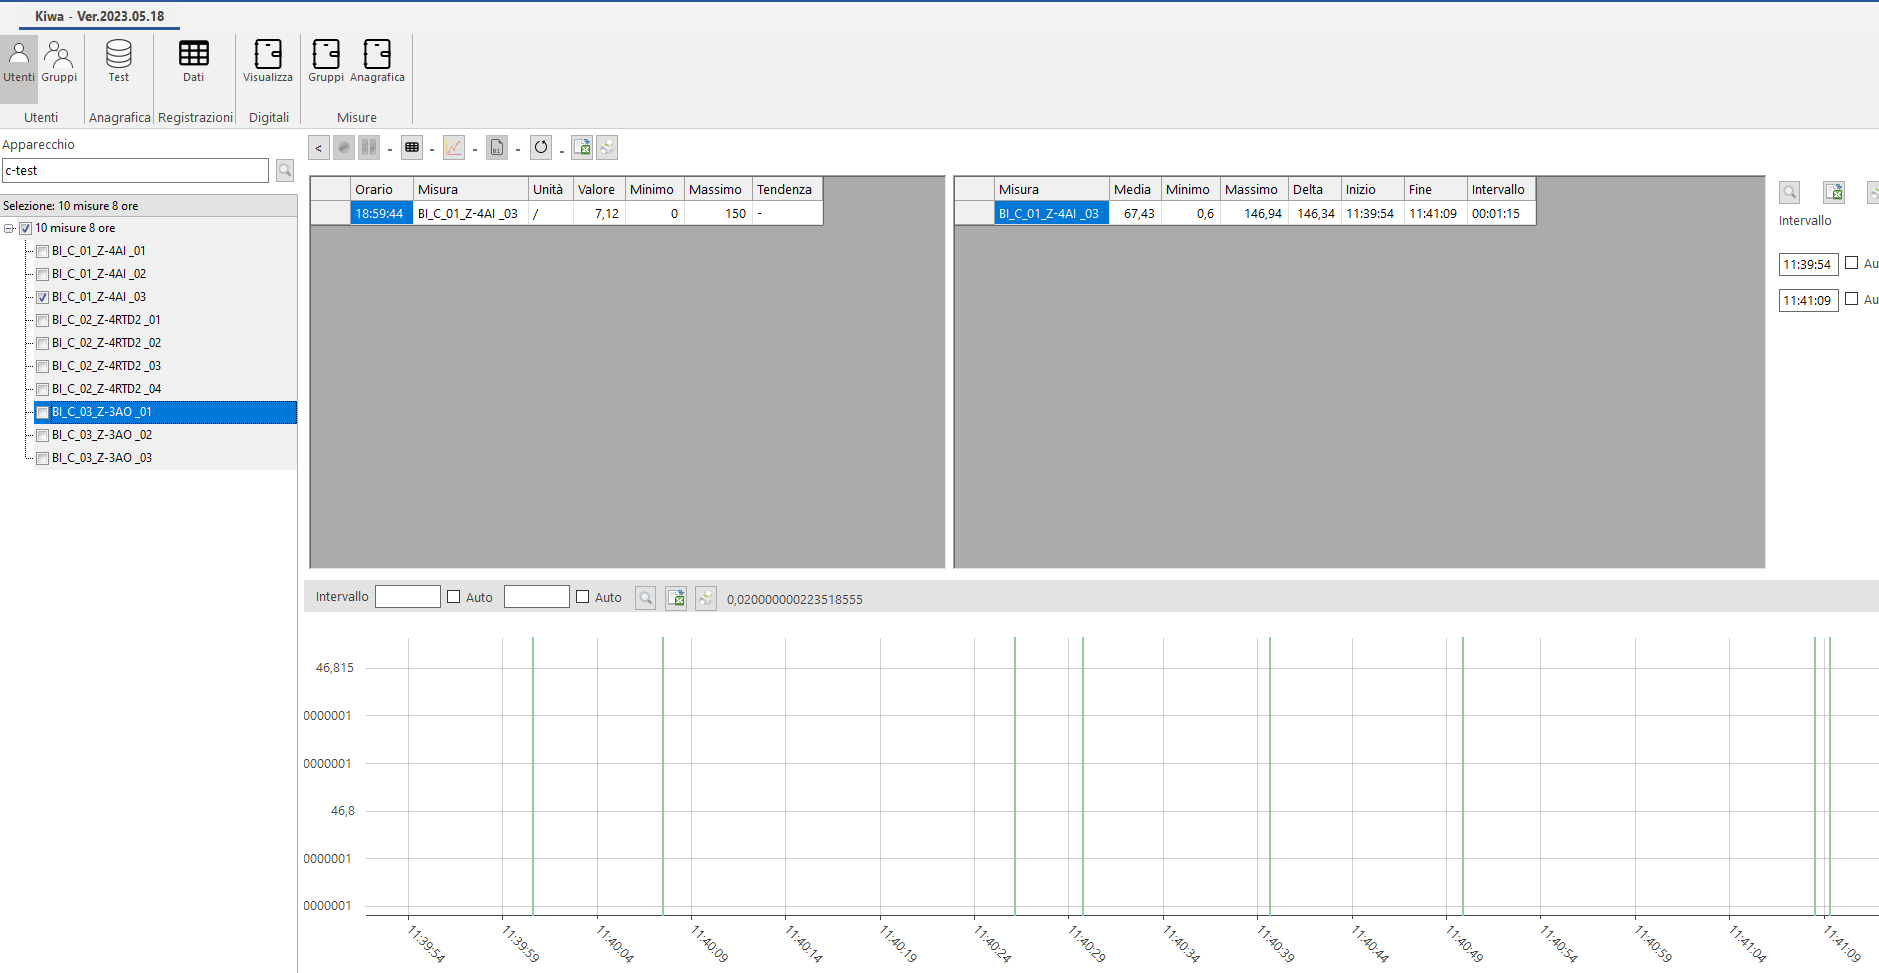
    I have a problem with .NET Winform FlexChart when I apply the zoom on the chart

    This problem seems random and produce this incorret visualization: the Axis Y label has shown incorrectly.

    See attached file.

    I make this setting

    _fChart.AxisY.MinorUnit = 0.001;

    but the problem appears again.

    Can someone help me or give me an idea to solve it, please?

    Thanks

  • Posted 19 May 2023, 7:51 am EST

    Potresti postarci una bozza del codice e scrivere esattamente cosa devi ottenere?

    Sembra che in realtà stia scrivendo un valore che straborda a SX…

  • Posted 21 May 2023, 5:42 pm EST

    Hi Alex,

    Apologize for the delay.

    We are unable to replicate this issue at our end. As Fabio said, could you please provide some more information like code snippet or a small sample? So, that we can investigate this issue and assist you accordingly.

    Regards,

    Nitin

  • Posted 21 May 2023, 5:53 pm EST

    Hi Fabio,

    I solved my problem with this istruction:

    _fChart.AxisY.Format = “N3”;

    Have a good day

    Alex

Need extra support?

Upgrade your support plan and get personal unlimited phone support with our customer engagement team

Learn More

Forum Channels