Gantt Chart Y Axis Annotation Formating

Posted by: graham on 14 September 2019, 4:40 pm EST

    • Post Options:
    • Link

    Posted 14 September 2019, 4:40 pm EST

    I have set the Scale at Min 8 and Max 18.

    My concept of that is Time, 8:00AM to 6:00PM.

    When I go to Annotation and Format selecting DateShortTime the displayed Value for every MajorScaleUnit is 20:00AM.

    How do I achieve my required result:-

    8:ooAM, 9:00AM, 10:00Am and etc. please?

  • Posted 15 September 2019, 6:05 pm EST

    Hi Graham,

    The DateTime values on value axis(i.e. Y-Axis) are represented in their double equivalent (i.e. OA Date). So, you need to specify the Axis.Min/Max as follows:

    c1Chart1.ChartArea.AxisY.Min = startDate.ToOADate();  //startDate = 16/9/2019 8:0:0
    c1Chart1.ChartArea.AxisY.Max = endDate.ToOADate(); //endDate = 16/9/2019 18:0:0
    

    then format the axis annotations to use short time format as follows:

    c1Chart1.ChartArea.AxisY.AnnoFormat = C1.Win.C1Chart.FormatEnum.DateShortTime;
    

    Also, for having a gap of 1 hour between axis labels, you can specify the Axis.UnitMajor as follows:

    c1Chart1.ChartArea.AxisY.UnitMajor = 0.05;
    

    Please refer to the attached sample(prj_AxesSettings.zip) for the same.

    Regards,

    Basant

    prj_AxesSettings.zip

  • Posted 15 September 2019, 7:13 pm EST

    That may well work in Code and for C#.

    I work with VB.Net and this is code rather than the UI selections.

    Please update this.

    Regards, Graham.

  • Posted 15 September 2019, 11:15 pm EST

    Please give this to me in VB.Net Syntax.

    I don’t do C#

  • Posted 16 September 2019, 3:47 pm EST

    Hi Graham,

    Sorry for the inconvenience. Please refer to the attached VB sample for doing the same.

    Regards,

    Basant

    prj_AxesSettings_VB.zip

  • Posted 21 September 2019, 10:04 pm EST

    Thank you for your response, Basant.

    Unfortunately it is non working for me and I’d like you to give it a bit more time please.

    I attach what I have achieved from your example and the Data I am using. It’s a simple MS Access Database.

    Note that the Gantt Chart is used to display the Occupancy of the rooms and I also want to be able to Return the UserID and The ClientID in the ToolTip.SSOccupancy.zip

  • Posted 22 September 2019, 4:52 pm EST - Updated 3 October 2022, 3:40 pm EST

    Hi Graham,

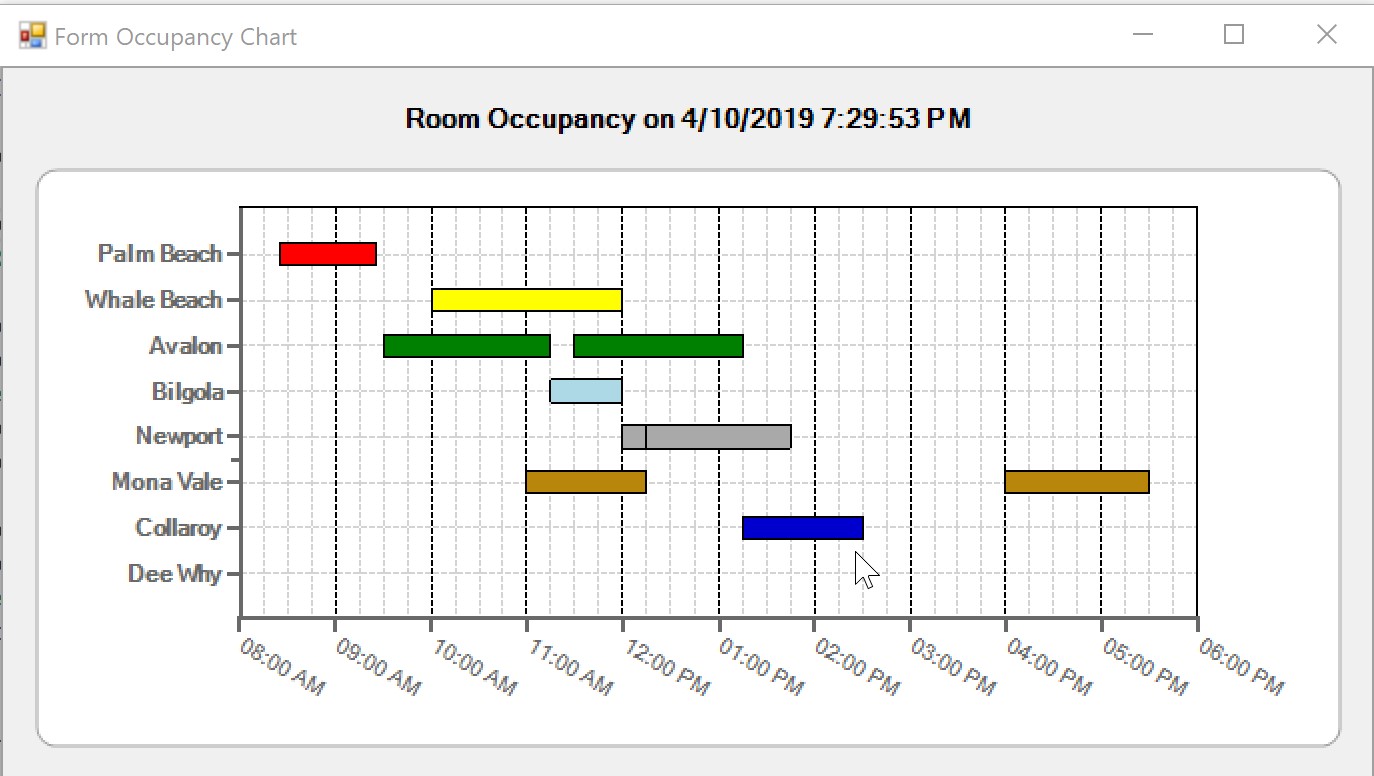
    I could not see any issue with the axis annotations after correctly specifying the ChartDataSeries.Label property to RoomName column in your sample.

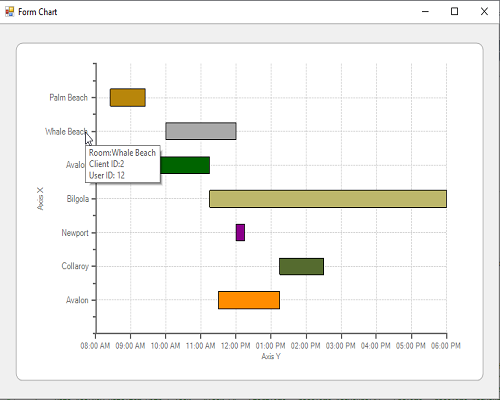
    Also, for displaying data item values in the tooltip, you can make use of CoordToDataIndex method for getting the index of the underlying data item and do the following:

    Private Sub C1ChartRoomOccupancy_ShowTooltip(sender As Object, e As ShowTooltipEventArgs)
            If sender.Equals(C1ChartRoomOccupancy.ChartArea.AxisX) Then
                Dim position = C1ChartRoomOccupancy.PointToClient(Control.MousePosition)
                Dim serIdx = 0, ptIdx = 0, dist = 0
                C1ChartRoomOccupancy.ChartGroups.Group0.CoordToDataIndex(position.X, position.Y, CoordinateFocusEnum.XCoord, serIdx, ptIdx, dist)
                Dim item = Me.SalonAndSpaDb2DataSet.tblRoomOccupancy.Item(serIdx)
                e.TooltipText = "Room:" & item.RoomName & vbCrLf & "Client ID:" & item.ClientID & vbCrLf & "User ID: " & item.UserID
          End If
    End Sub
    

    Please refer to the attached modified sample(SSOccupancy_Mod.zip) for the same.

    Regards,

    Basant

    SSOccupancy_Mod.zip

  • Posted 24 September 2019, 4:47 pm EST

    Many thanks Basant. Your expertise is getting me there fast. I made some changes to the Tooltip Code as below, because I want the users to be able to see the Occupancy details in any room.

    Private Sub C1ChartRoomOccupancy_ShowTooltip(sender As Object,

    e As ShowTooltipEventArgs)

    If Not sender.Equals(C1ChartRoomOccupancy.ChartArea.AxisX) Or

    Not sender.Equals(C1ChartRoomOccupancy.ChartArea.AxisY) Then

    Dim position = C1ChartRoomOccupancy.PointToClient(Control.MousePosition)

    Dim serIdx = 0, ptIdx = 0, dist = 0

    C1ChartRoomOccupancy.ChartGroups.Group0.CoordToDataIndex(position.X,

    position.Y,

    CoordinateFocusEnum.XCoord,

    serIdx, ptIdx, dist)

    Dim item = Me.SalonAndSpaDb2DataSet.tblRoomOccupancy.Item(serIdx)

    e.TooltipText = item.UserID & " in " & item.RoomName & vbCrLf &

    "with " & item.ClientID & vbCrLf &

    "from " & Format(item.StartTime, “hh:mm”) & " " &

    "to " & Format(item.EndTime, “hh:mm”)

    End If

    End Sub

    Now there are two more issues that I hope you can help me with.

    1. A room may be occupied by more than a single event in a day, as is the case with the Avalon Room. Notice above how it is shown on separate rows. I’d like to show the two Avalon Room events on the same XAxis Row.

    2. Room Occupancy Time Increments can vary in different situations. Here, I’m using a 15 minute Time Increment. Lawyers use a 6 minute Time Increment. I’m using a Settings Value to set this. Now, I can’t get the YAxis to display a Minor Grid.

      Below is my code that doesn’t seem to work for me. What am I missing please?

       C1ChartRoomOccupancy.ChartArea.AxisY.GridMajor.Visible = True
       C1ChartRoomOccupancy.ChartArea.AxisY.GridMajor.Spacing = 2
       C1ChartRoomOccupancy.ChartArea.AxisY.GridMinor.Visible = True
       C1ChartRoomOccupancy.ChartArea.AxisY.GridMinor.Spacing = 0.25
       C1ChartRoomOccupancy.ChartArea.AxisY.Min = startDate.ToOADate()
       C1ChartRoomOccupancy.ChartArea.AxisY.Max = endDate.ToOADate()
       C1ChartRoomOccupancy.ChartArea.AxisY.AutoMinor = False
      

    Regards, Graham.

  • Posted 24 September 2019, 6:22 pm EST

    My apologies Basant. I failed to mention that the Users will be able to use a Settings value to create their Rooms and each Room’s Available time on any Weekday. So, I am imagining that the InitChart Sub will initially set the XAxis Labels. What are your thoughts?

    Regards, Graham.

  • Posted 24 September 2019, 9:59 pm EST

    Hi Graham,

    Thanks for the acknowledgment.

    1. As we see we need to add a series in the chart for one row in Gantt chart. So, to represent all the events(room occupancy) for a room in the same row we need to add the array of start times in ChartDataSeries.Y and that of end times in ChartDataSeries.Y1 for that room. So, for this, we can group our data by room names and then do the following:
    Dim Data = Me.SalonAndSpaDb2DataSet.tblRoomOccupancy 'GetData()
    GroupedData = Data.GroupBy(Function(row) New With {Key .RoomName = row.RoomName})
    For Each item In GroupedData
        Dim ser = grp0.ChartData.SeriesList.AddNewSeries()
        ser.Label = item.Key.RoomName
        Dim startTimes = item.Select(Of DateTime)(Function(row) row.StartTime).ToArray()
        Dim endTimes = item.Select(Of DateTime)(Function(row) row.EndTime).ToArray()
        ser.Y.CopyDataIn(startTimes)
        ser.Y1.CopyDataIn(endTimes)
    Next
    
    1. Can you please confirm that you are specifying the correct value for the minor grid spacings? For example, for 15 minutes increment, you need to specify the Spacing as follows:
    '15 Minutes Increment
    C1ChartRoomOccupancy.ChartArea.AxisY.GridMinor.Spacing = 1.0 / (24 * 60) * 15 
    

    So, I am imagining that the InitChart Sub will initially set the XAxis Labels. What are your thoughts?

    Yes, with the current code, axis labels will be set initially. However, if needed, you can modify the ValueLabels collection(if used) later as well.

    Please verify the above-mentioned implementation with the attached sample.

    Regards,

    Basant

    SSOccupancy_Mod2.zip

  • Posted 29 September 2019, 5:21 pm EST

    Hi Basant, you are the man!

    You have given me tremendous help with my Room Occupancy Chart Project.

    I’ve been waiting for about 5 years to have this Gantt Chart work for me. At last you have made it happen.

    Notice that I have adjusted the ShowTooltip code. This gives the user a quick glance at what’s happening in each room without having to refer back to C1Scheduler.

    Your advice on Setting the MinorYGrid to 15 minute intervals is perfect. That method allows me to let the User select an Interval of their choosing. Whether that is 6, 10, 15 or whatever Increment they want. Have a look please?

    Now I have a couple of other items I’d like some help with please? I’m trying to do all this in Code rather than use the Control’s Wizard.

    The Application Setup allows the User to Set their User Settings in App.config.

    1. I would like the User to be able to Set their RoomNames. There maybe more Rooms on any Day that the Chart shows than there is Occupancies. Now I can’t see how to do this. You will notice that there are more Rooms in the Database than there are Occupancies. Of course, I want the user to be able to select any unused room, if it offers a better time availability for the Client than any of the other rooms.
    2. I would also like to allow the User to select the ChartData Color. I can’t see how to do that. Is it possible? I have looked at the Online Help File and it seems to relate to a previous version. So, I’m stumped.
    3. I’d like the XAxis and YAxis ValueLabels to have a Bold Font. Again, I can’t see how to do that. There is no Help File.
    4. I’d like the YAxis to have a 30 degree Rotation. I have put that into the code and it is not working.

      Now you have got me “Cooking on Gas” here! I hope you can have me grinning like a Cheshire Cat.

      Regards, Graham.Salon and Spa Studio 2019.zip
  • Posted 29 September 2019, 7:16 pm EST

    Hi again Basant,

    What I have failed to say is that each “Presentation” of the RoomOccupancy Chart would be for a single day. Because, in the Code you have use 2 Variables, startTimes and endTimes, also startDate and endDate; I found this confusing.

    So. I have since changed the startDate and endDate Variables to startTime and endTime. To me, this seems more understandable.

    Regards, Graham.

  • Posted 29 September 2019, 10:50 pm EST

    Hi Graham,

    Good to know that things are working for you.

    1. As per my understanding, you want to display all rooms available in App.Config files onto chart irrespective of its occupancy in db. For this, you can populate data in chart as follows:
    Dim settingsSection = DirectCast(ConfigurationManager.GetSection("userSettings/Salon_and_Spa_Studio_2019.My.MySettings"), ClientSettingsSection)
    C1ChartRoomOccupancy.ChartArea.AxisX.AnnoMethod = AnnotationMethodEnum.ValueLabels
    rooms = New List(Of String)
    Dim idx = 0
    For Each setting As SettingElement In settingsSection.Settings
     If setting.Name.ToLower().Contains("room") Then
      Dim name = setting.Value.ValueXml.InnerText
      C1ChartRoomOccupancy.ChartArea.AxisX.ValueLabels.Add(idx, name)
      Dim ser = grp0.ChartData.SeriesList.AddNewSeries()
      ser.Label = name
      rooms.Add(name)
      If GroupedData.Any(Function(row) row.Key.RoomName = name) Then
       Dim item = GroupedData.FirstOrDefault(Function(row) row.Key.RoomName = name)
       Dim startTimes = item?.Select(Of DateTime)(Function(row) row.StartTime).ToArray()
       Dim endTimes = item?.Select(Of DateTime)(Function(row) row.EndTime).ToArray()
       ser.Y.CopyDataIn(startTimes)
       ser.Y1.CopyDataIn(endTimes)
      End If
      ser.FillStyle.Color1 = colors(idx)
      idx += 1
     ElseIf setting.Name.ToLower().Contains("increment") Then
      C1ChartRoomOccupancy.ChartArea.AxisY.GridMinor.Spacing = (1.0 / (24 * 60)) * Int32.Parse(setting.Value.ValueXml.InnerText)
     End If
    Next
    
    1. As specified in the above code snippet, you can use ChartDataSeries.FillStyle.Color1 property to set the color for the bars in a Series.

    2. You can specify the Axis.Font property as follows:

    C1ChartRoomOccupancy.ChartArea.AxisX.Font = New Font("Segoe-UI", 10, FontStyle.Bold)
    C1ChartRoomOccupancy.ChartArea.AxisY.Font = New Font("Segoe-UI", 10, FontStyle.Bold)
    
    1. As per my understanding, you want to rotate the axis labels/annotations, so you can make use of Axis.AnnotationRotation property as follows:
    C1ChartRoomOccupancy.ChartArea.AxisY.AnnotationRotation = 30
    

    Please refer to the attached modified sample for the above implementations.

    Salon and Spa Updated.zip

    Also, just in case, you can refer to the C1Chart documentation(https://help.grapecity.com/componentone/NetHelp/c1chart2d/webframe.html#componentone2dchartf.html) for better understanding of its structure and settings.

    Regards,

    Basant

  • Posted 29 September 2019, 11:18 pm EST

    Hi Basant, as I said; you are the man!

    I haven’t had the time to try this yet. But, I’m sure I will be thrilled with the result.

    It’s about 10:10 PM on Monday here. I’ll give it a run and get back to you.

    Would you give me your email address please and then we can take this offline.

    Regards, Graham.

  • Posted 30 September 2019, 9:58 am EST - Updated 3 October 2022, 3:40 pm EST

    Hi Basant,

    When I un the App in Debug Mode I get the following error.

    Could you help me on this please?

  • Posted 30 September 2019, 3:23 pm EST

    Hi Graham,

    Sorry for the inconvenience. I added the following settings in your App.Config file for testing purpose :

    <RoomSettings>
        <add key="Room1" value="Palm Beach"/>
        <add key="Room2" value="Whale Beach"/>
        <add key="Room3" value="Avalon"/>
        <add key="Room4" value="Bilgola"/>
        <add key="Room5" value="Newport"/>
        <add key="Room6" value="Mona Vale"/>
        <add key="Room7" value="Collaroy"/>
        <add key="Room8" value="Dee Why"/>
    </RoomSettings>
    

    However, deleting them will resolve the issue.

    Regards,

    Basant

  • Posted 30 September 2019, 5:12 pm EST

    Hi there my friend!

    As I’ve said; “You are the Man”!

    The result you have here is beautiful! Something of excellence.

    I’ve not seen Settings used in that way so I have learnt heaps.

    I will attempt to incorporate the Colors Method you have used into the Settings that the User will select for each Room that they have. Elsewhere in the App I have a ColorsForm that I will use to allow the User to make their choice. I will incorporate that. I may yell out if I goof up. :wink:

    Basant, I thank you very much for your help and I wish you to refer my accolades of you to your Superior. I will look forward to his response.

    After 5 years of waiting for a C1 Gantt Chart that can be Bound to a Database Table; I’m now there!

  • Posted 30 September 2019, 6:13 pm EST

    Thank you, Graham, for such a pleasing acknowledgment. Good to know that we could help you to achieve your objective.

    Thanks,

    Basant

  • Posted 30 September 2019, 6:32 pm EST

    Woops…

    I don’t think I understand your handling of the UserSettings, well enough.

    I have Added the following to the Settings.

    Now I need to use your Method to Return them.

    Can you give me a guide please?

    Attached is my changed App.Config file.

    Regards, Graham.

  • Posted 30 September 2019, 6:40 pm EST

    Sorry. I Dropped the File in the wrong area.

    Regards, Graham.

  • Posted 30 September 2019, 6:46 pm EST

    Sorry again!

    Wrong Format.AppConfig.zip

  • Posted 30 September 2019, 9:19 pm EST

    Graham,

    As, In my logic, I was checking the setting element name to identify what value it will provide so, you can simply update the conditions according to the App.Config as follows:

    If setting.Name.ToLower().Contains("roomname") Then
    ...
    
    ElseIf setting.Name.ToLower().Contains("roomcolour") Then
     grp0.ChartData.SeriesList(Int32.Parse(setting.Name.Last().ToString()) - 1).FillStyle.Color1 = Color.FromName(setting.Value.ValueXml.InnerText.ToString())
    
    ElseIf setting.Name.ToLower().Contains("increment") Then
    ...
    
    End If
    

    Regards

  • Posted 30 September 2019, 10:28 pm EST

    Hi Basant,

    Beautiful. Works like a charm!

    But, what do we do with the Sub…

        Public Sub New()
            ' This call is required by the designer.
            InitializeComponent()
            ' Add any initialization after the InitializeComponent() call.
            colors = New List(Of Color)
            colors.Add(Color.Blue)
            colors.Add(Color.Yellow)
            colors.Add(Color.Green)
            colors.Add(Color.LightBlue)
            colors.Add(Color.DarkGray)
            colors.Add(Color.DarkGoldenrod)
            colors.Add(Color.DarkBlue)
            colors.Add(Color.Pink)
            colors.Add(Color.DarkKhaki)
            colors.Add(Color.LightGray)
        End Sub[b][/b]
    

    It seems to be irrelevant now?

    Regards, Graham.

  • Posted 30 September 2019, 10:36 pm EST

    Yes, that was just for showing you how custom colors can be used with C1Chart. You can remove the usage of the colors list from code now.

    Regards

  • Posted 30 September 2019, 10:46 pm EST

    If I edit it as follows, the App Errors.

    Public Sub New()
        ' This call is required by the designer.
        InitializeComponent()
        ' Add any initialization after the InitializeComponent() call.
        colors = New List(Of Color)
        'colors.Add(Color.Blue)
        'colors.Add(Color.Yellow)
        'colors.Add(Color.Green)
        'colors.Add(Color.LightBlue)
        'colors.Add(Color.DarkGray)
        'colors.Add(Color.DarkGoldenrod)
        'colors.Add(Color.DarkBlue)
        'colors.Add(Color.Pink)
        'colors.Add(Color.DarkKhaki)
        'colors.Add(Color.LightGray)
    End Sub
    

    How should I treat this Sub?

  • Posted 1 October 2019, 11:16 pm EST

    If I remove the initialization after the InitializeComponent() call The App Errors.

    Clearly, colors = New List(Of Color) and colors.Add(ColorName) has to be in the Readings of Settings Code. Please show me where?

    Regards, Graham.

  • Posted 2 October 2019, 3:55 pm EST

    Hi Graham,

    Since we have stored room colors in the App.Config settings now so, there will be no need for any additional color collection. Please refer to the attached sample for more clarity.

    Regards,

    Basant

    Salon and Spa Updated2.zip

  • Posted 3 October 2019, 9:10 pm EST

    Hi Basant,

    You have now provided a C1Chart_Gantt example that does exactly what I have needed, since I first started with C1Chart, 5 years ago. It is now a DataBindable Product at last.

    Now, there is an issue that I have found and it rates as Developer Bug, that I hope you will report.

    If I use the following Code:

    ```

    C1ChartRoomOccupancy.ChartArea.AxisX.AutoMinor = False

    All MinorTicks are not Visible, excepting for [b]ONE[/b].  Notice it on the attached Graphic.  However, If I add the Code: -
            ```
    C1ChartRoomOccupancy.ChartArea.AxisX.AutoMinor = False
            C1ChartRoomOccupancy.ChartArea.AxisX.TickMinor = False
    

    All MinorTicks are removed. This is of course, what I want.

    All is good! I’m a “Happy Chappy Now”. :blush:

    Regards, Graham.

  • Posted 3 October 2019, 9:13 pm EST - Updated 3 October 2022, 3:39 pm EST

    Sorry, I forgot to Attach the Image.

    Here it is.

  • Posted 6 October 2019, 6:36 pm EST

    Hi Graham,

    Good to know that you could achieve what you want. However, just to let you know, the behavior of C1Chart not hiding minor ticks when setting Axis.AutoMinor = False is not a bug. As the property name suggests, It just informs the chart that there is no need to automatically calculate the Axis.UnitMinor. And hence, Axis.UnitMinor having some value, the minor ticks will be displayed accordingly.

    Also, using Axis.TickMinor is the correct way to display/hide the minor tics (as you already have used Axis.TickMinor = False for hiding the minor ticks).

    Thanks,

    Basant

  • Posted 14 October 2019, 6:37 pm EST

    Now I have another issue.

    I have introduced Globalisation into the Solution and I’m now getting some Errors and Warnings which are of some concern.

    I’d like to send you the Solution for your Changes to the ChartInit() code. But I would not like this to be in the Public Domain.

    Would you please give me a Web Space where I can upload a file to you in Private please?

    Regards, Graham.

  • Posted 14 October 2019, 8:47 pm EST

    Hi Graham,

    I have created a ticket for you on our private support portal i.e. SupportOne. Please follow the link given below for further processing.

    http://supportone.componentone.com/home/casedetail/401812

    Regards,

    Basant

  • Posted 14 October 2019, 10:11 pm EST

    Hi Basant,

    Oh!.. You are GREAT!

    Thank You. It’s on the way.

    Regards, Graham.

Need extra support?

Upgrade your support plan and get personal unlimited phone support with our customer engagement team

Learn More

Forum Channels