Is it possible to enable/disable the series in the Chart

Posted by: amit.jain3 on 26 April 2023, 8:58 pm EST

  • Posted 26 April 2023, 8:58 pm EST

    Hello,

    If I have 15-20 series plotted into the same chart and I want to view a specific series is it possible to hide other series and enable the specific one?

    1 more thing I would like to ask. As of now I am using C1Charts which have 2 axis X/Y. If I want to introduce new Axis “Z” can it be done in the normal charts or for that we need to use 3D one?

  • Posted 29 April 2023, 10:09 pm EST

    Hi Amit,

    You can set the Display property of C1Chart’s SeriesList items to Hidden for the series which you want to hide. Please refer to the following code:

    c1Chart1.ChartGroups[0].ChartData.SeriesList[1].Display = C1.Win.C1Chart.SeriesDisplayEnum.Hide;

    Kindly refer to the attached sample for full implementation. (Download C1ChartHideSeries.zip using the link: *https://www.dropbox.com/s/0ir1yug2v9t66h7/C1ChartHideSeries.zip?dl=0)

    > 1 more thing I would like to ask. As of now I am using C1Charts which have 2 axis X/Y. If I want to introduce new Axis “Z” can it be done in the normal charts or for that we need to use 3D one?

    You can achieve the requirement by using C1Chart3D control. Please refer to the following documentation link for the same: *https://www.grapecity.com/componentone/docs/win/online-chart3d/overview.html

    Hope this helps. Please let us know if you have any further concerns.

    Thanks & Regards,

    Aastha

  • Posted 2 May 2023, 9:34 pm EST

    Thank you Aastha for the information. I’ll look into the solution and get back to you if I have doubts.

  • Posted 2 May 2023, 11:03 pm EST

    Hello Aastha, Is it possible to add the ZIP for Hide Series Directly Here.

    dropbox links are not accessible for me

  • Posted 3 May 2023, 4:02 pm EST

    Hi Amit,

    Sorry for the inconvenience caused.

    Please find the sample attached. (Refer C1ChartHideSeries.zip)

    Kindly let us know if you have any further issues.

    Thanks & Regards,

    Aastha

  • Posted 3 May 2023, 6:36 pm EST

    Hi Aastha,

    Sorry for the inconvenience, Can you share an example without using Database connections. I cannot run the solution.

  • Posted 3 May 2023, 9:10 pm EST - Updated 3 May 2023, 9:15 pm EST

    Hi Aastha,

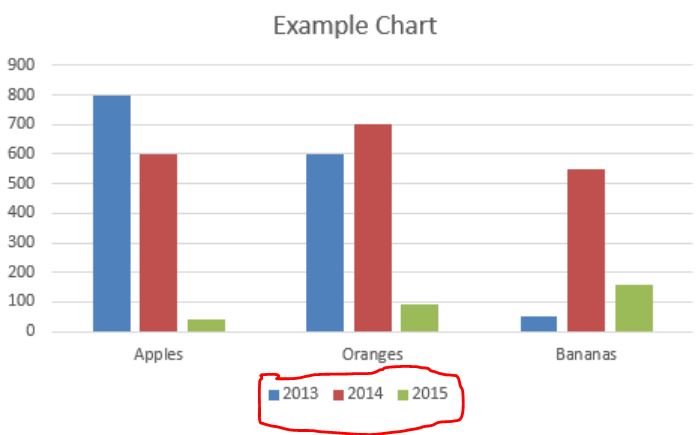
    I have 1 more question In the Image I have marked a value and I believe that is called Legend.

    If yes I am using below Line to show the legend -

    c1Chart1.Legend.TooltipText = “Hello”;

    c1Chart1.Legend.Orientation = LegendOrientationEnum.Auto;

    c1Chart1.Legend.Text = “Chart”;

    But it is not working. can you correct me what wrong I am doing

  • Posted 4 May 2023, 2:01 am EST

    Hi Aastha,

    I am able to get the Legends. Is it possible to populate all the Legends into a dropdown?

  • Posted 5 May 2023, 4:43 am EST

    Hi Amit,

    You can populate all the legends in a combobox by accessing each element of C1Chart.ChartGroups[0].ChartData’s SeriesList property. You can refer to the following code snippet for the same:

    var seriesCollection = c1Chart1.ChartGroups[0].ChartData.SeriesList;
    comboBox1.Items.Clear();
    if (seriesCollection != null)
    {
        for(int i=0; i<seriesCollection.Count; i++)
        {
            comboBox1.Items.Add(seriesCollection[i]);
        }
    }
    

    > Can you share an example without using Database connections. I cannot run the solution.

    Taking into account the above requirement, we have created an updated version of the sample application where user can display a particular series selected in a combobox. Please refer C1ChartHideSeriesObj.zip

    Hope this helps. Please let us know if you have any further issues.

    Thanks & Regards,

    Aastha

Need extra support?

Upgrade your support plan and get personal unlimited phone support with our customer engagement team

Learn More

Forum Channels